SOC Automation Project - Part 4
Building a SOC automation Home Lab: Part 4 - TheHive configuration and setting up Wazuh Agent
A step-by-step guide for building your very own SOC Automation Home Lab using VMWare and DigitalOcean cloud provider
In this module, we will configure theHive different components in order to access its web user interface. Additionaly, we will create our Wazuh Agent from the Windows 10 VM we set up in Part 2 of this project.
Configuring theHive
TheHive is designed to manage and respond to security incidents, and we will use it as our case management tool.
To access its web user interface, we’ll need to make some changes to the configuration files of its different components. We will start with Cassandra, then Elasticsearch, and finally, theHive.
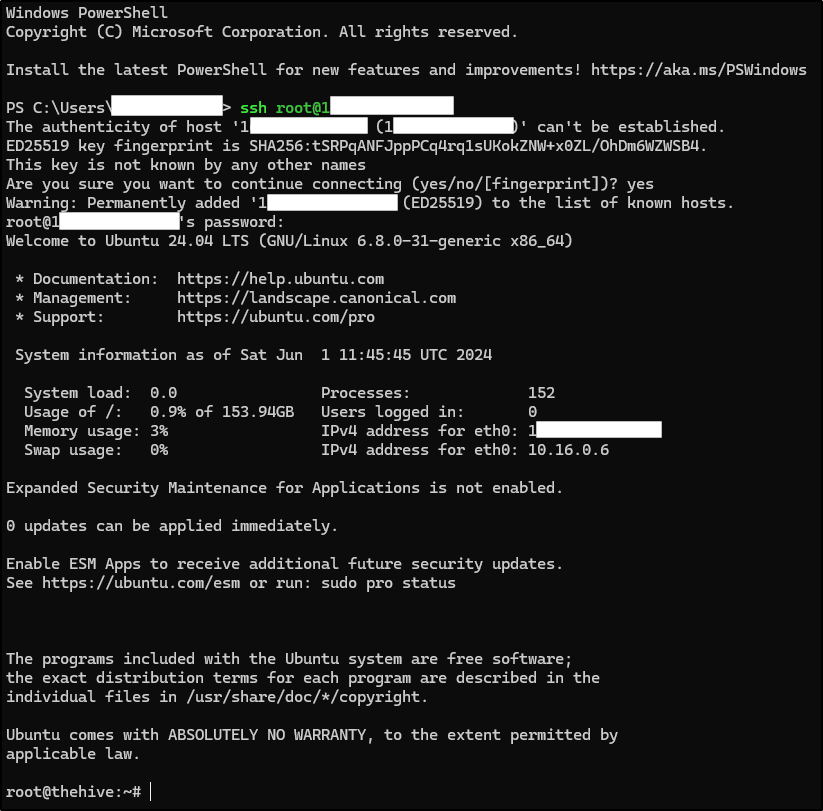
Before all this, we need to log into our theHive server with SSH.
1
2
# Acessing thehive via SSH
ssh root@"theHive_IP"
Cassandra Configuration
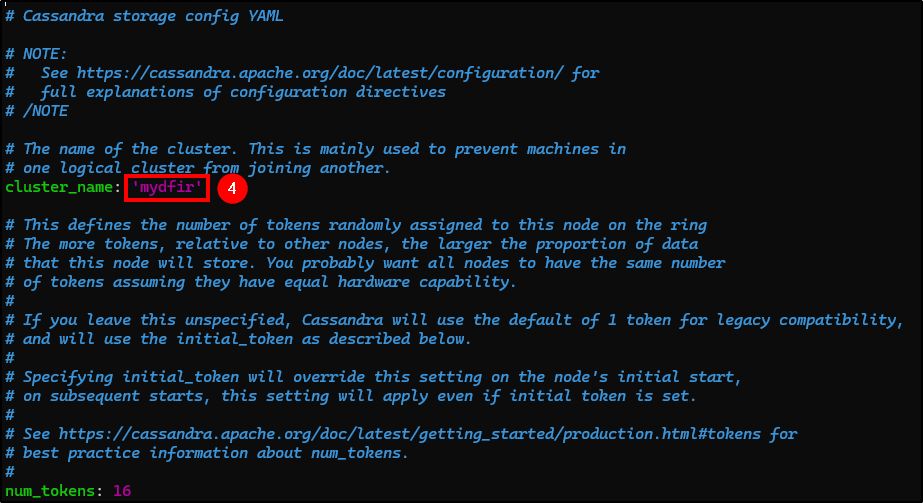
Cassandra is used as the primary data storage backend for theHive. It stores all the structured data, including cases, tasks, alerts, observables, and user information. In order to complete theHive installation, we will need to change some fields in Cassandra’s config file /etc/cassandra/cassandra.yaml. To do this, use the command below:
1
2
# Configuring Cassandra
nano /etc/cassandra/cassandra.yaml
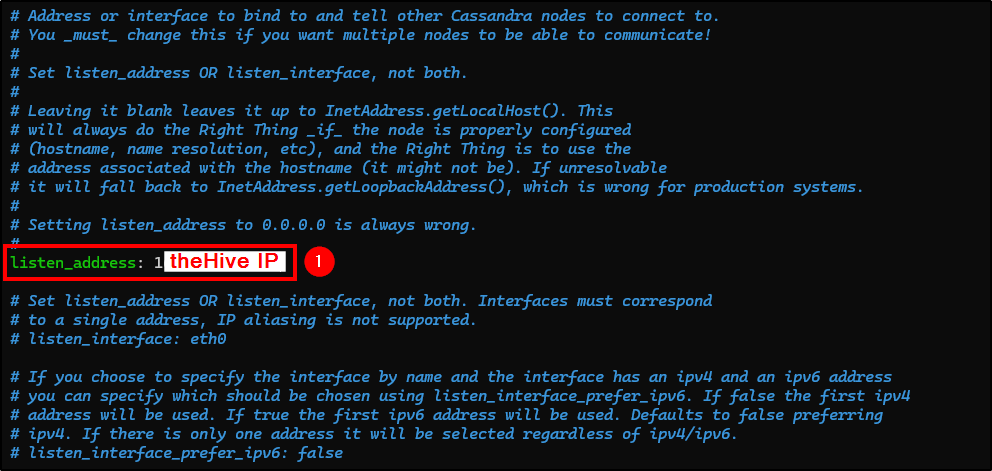
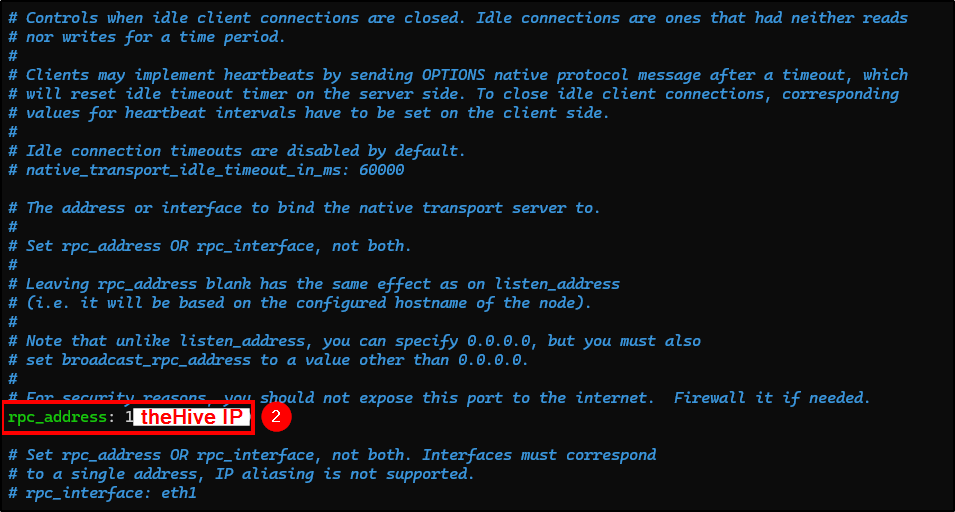
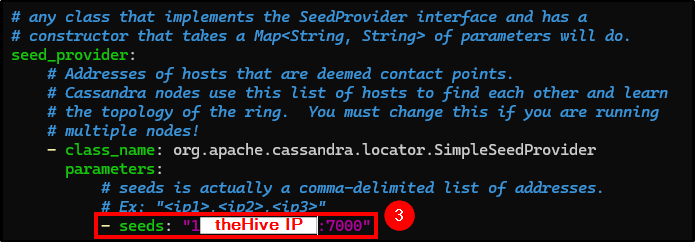
Change the following fields (you can use Ctrl+W to search for keywords):
- listen_address: Change it to theHive public IP.
- rpc_address: Change it to theHive public IP.
- seeds: Change it to theHive public IP.
- cluster_name: Name your cluster.
Save the changes with Ctrl+X and press Y. Now, stop Cassandra server and remove the files located at /var/lib/cassandra that came with theHive package installation.
1
2
3
4
5
# Stopping Cassandra
systemctl stop cassandra.service

# Remove older files
rm -rf /var/lib/cassandra/*
Finnaly, start Cassandra service and check if it is running.
Every changes made in config files must be followed by a service restart to check and implement the modifications.
1
2
3
4
5
# Restarting Cassandra
systemctl start cassandra.service

# Checking Cassandra service status
systemctl status cassandra.service
If the service is not running or the status is
active (exiled), check the system.log at/var/log/cassandra/system.logand see if any errors are being written.
Elasticsearch configuration
Elasticsearch is used to index and search data stored in theHive. It enables fast and flexible searching capabilities across all stored data, making it easy for users to find relevant cases, tasks, observables, and alerts.
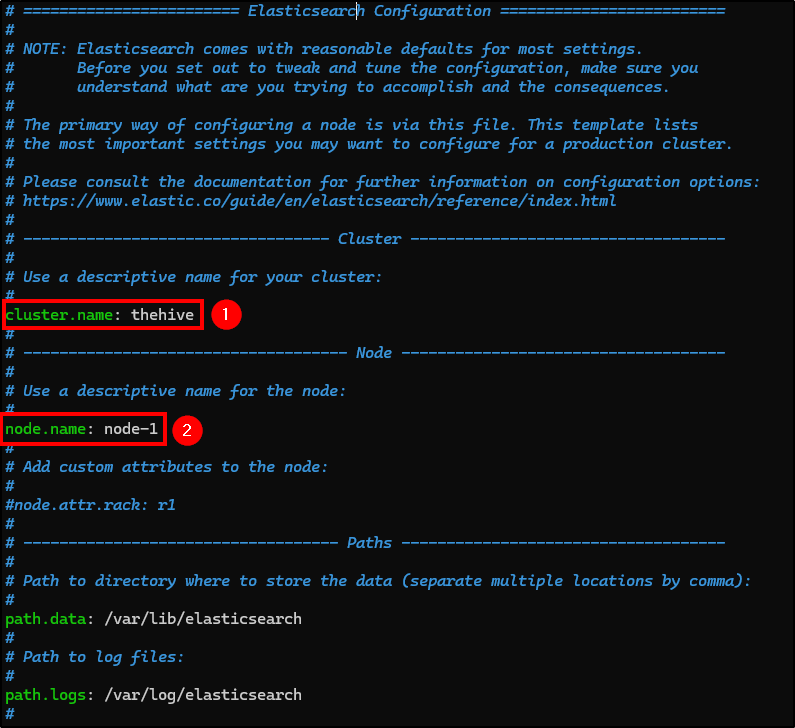
Again, we will need to make some changes in Elasticsearch config file.
1
2
# Configuring Elasticsearch
nano /etc/elasticsearch/elasticsearch.yml
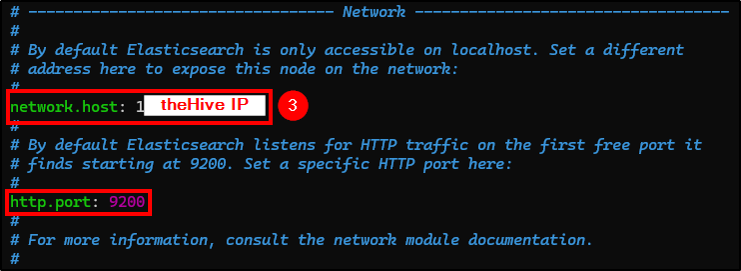
Change the following fields:
- cluster.name: Name your cluster.
- node.name: Uncomment it.
- network.host: Uncomment and change it to theHive’s public IP.
- http.port: Uncomment it.
- cluster.initial_master_nodes: Uncomment it and remove the second node.
For Elasticsearch to work, it needs a discovery seed or a cluster master node. Discovery seeds enable new nodes to discover and join the cluster efficiently, ensuring high availability and scalability. In this case we’ll not use them because we will have one node only.
Next, start and enable Elasticsearch service and check if it is running.
1
2
3
4
5
6
# Starting and enabling Elasticsearch service
systemctl start elasticsearch.service
systemctl enable elasticsearch.service

# Checking Elasticsearch service status
systemctl status elasticsearch.service
TheHive configuration
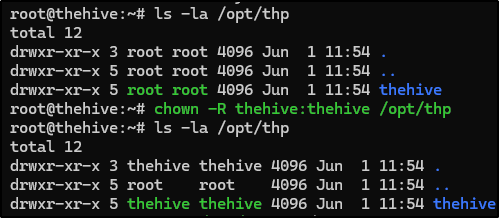
First, ensure that theHive user and group have access to the /opt/thp file path (we can check this with the ls -la command).
To change ownership, use the command bellow:
1
2
# Changing directory ownership
chown -R thehive:thehive /opt/thp
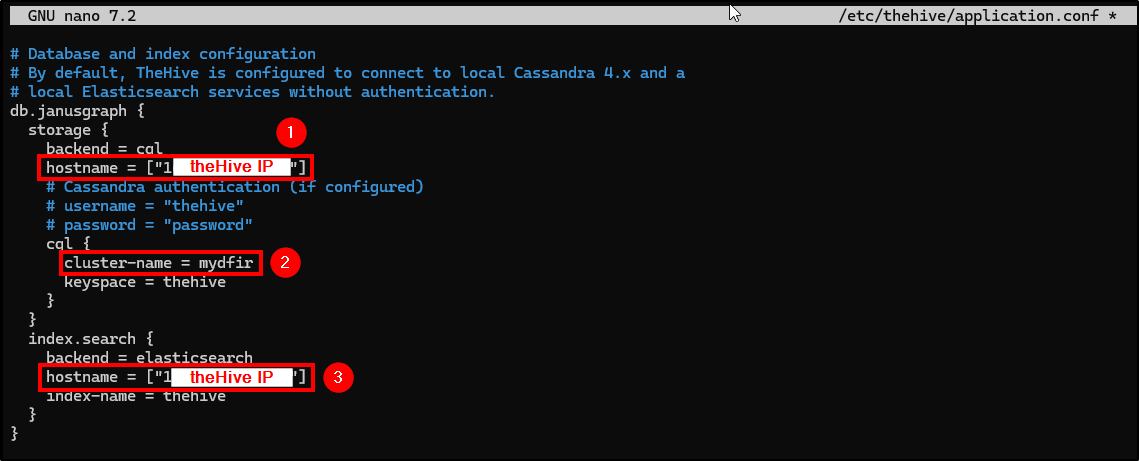
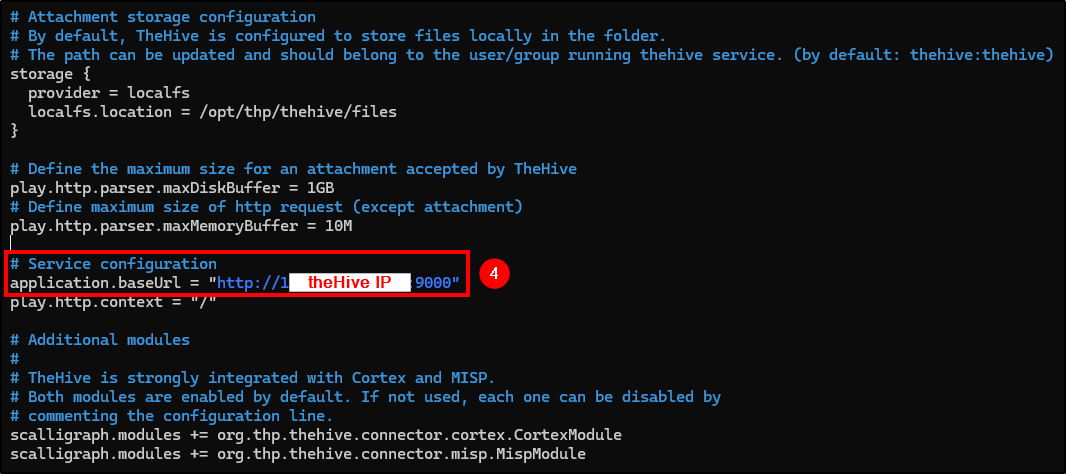
Now, we will need to change the following fields in theHive config file:
- db.janusgraph_hostname: Change it to theHive public IP.
- db.janusgraph_cluster-name: Change it to the cluster named on Cassandra’s config file.
- index.search_hostname: Change it to theHive public IP.
- application.baseUrl: Change it to: “https://
theHive_IP:9000”.
1
2
# Configuring theHive
nano /etc/thehive/application.conf
All that is left to do is to start and enable theHive service.
1
2
3
4
5
6
# Starting and enabling theHive service
systemctl start thehive
systemctl enable thehive

# Checking theHive service status
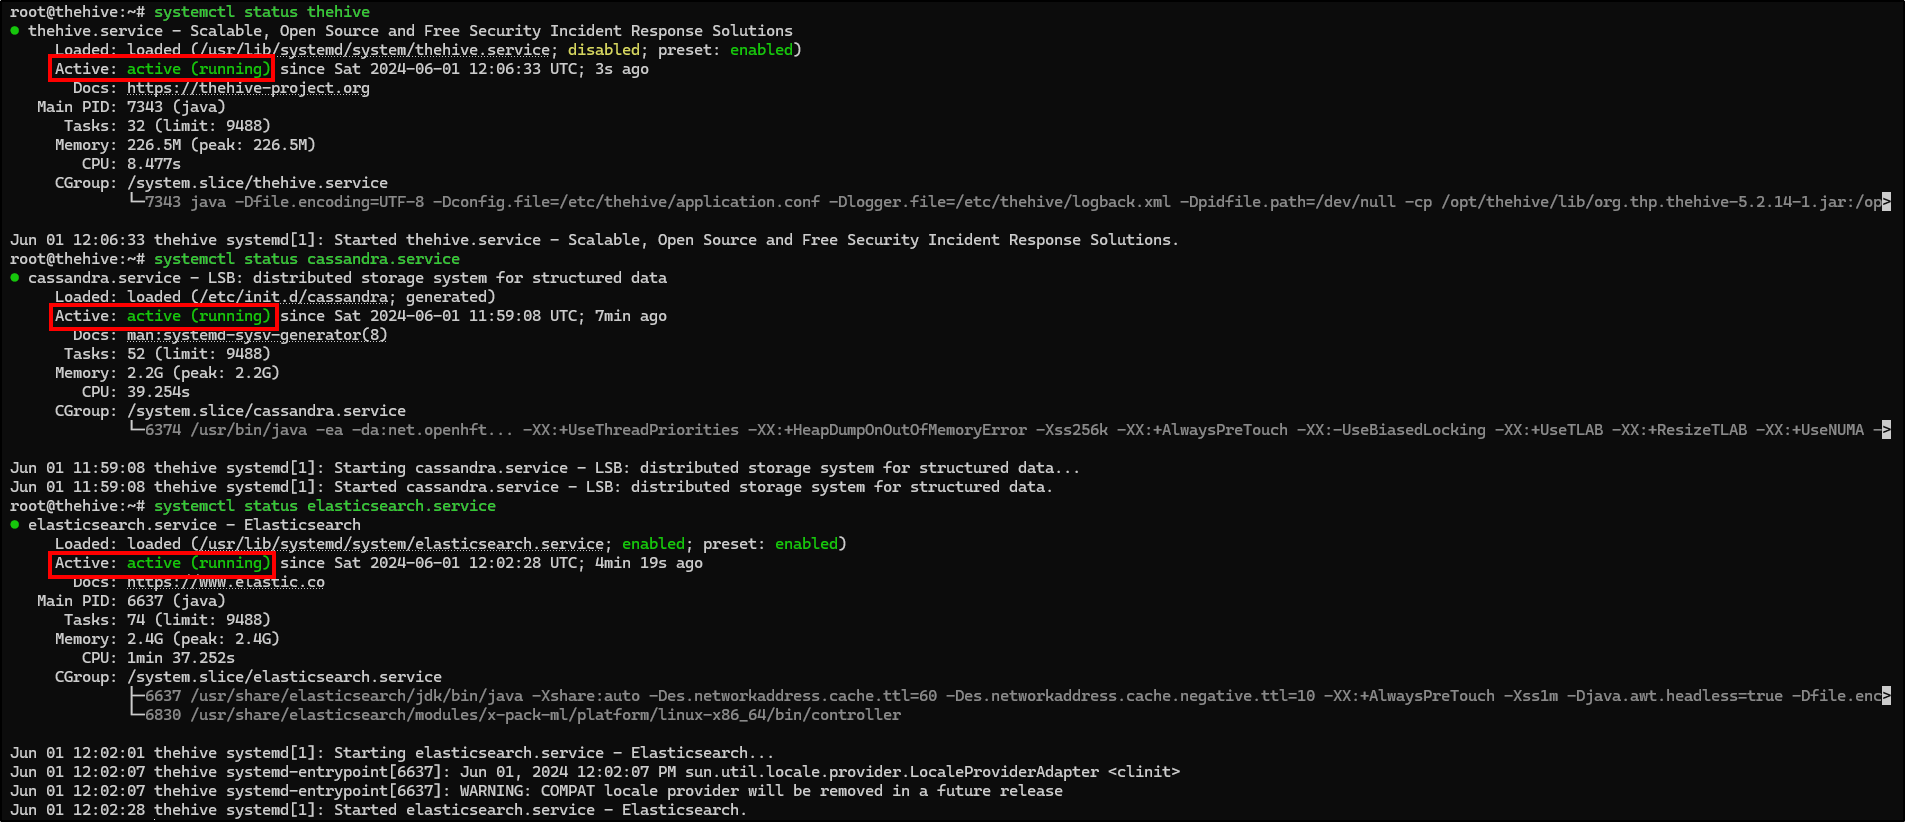
systemctl status thehive
Accessing theHive Web Portal
Before trying to access theHive web user interface, check if all three services are running. If not, you won’t be able to access it.
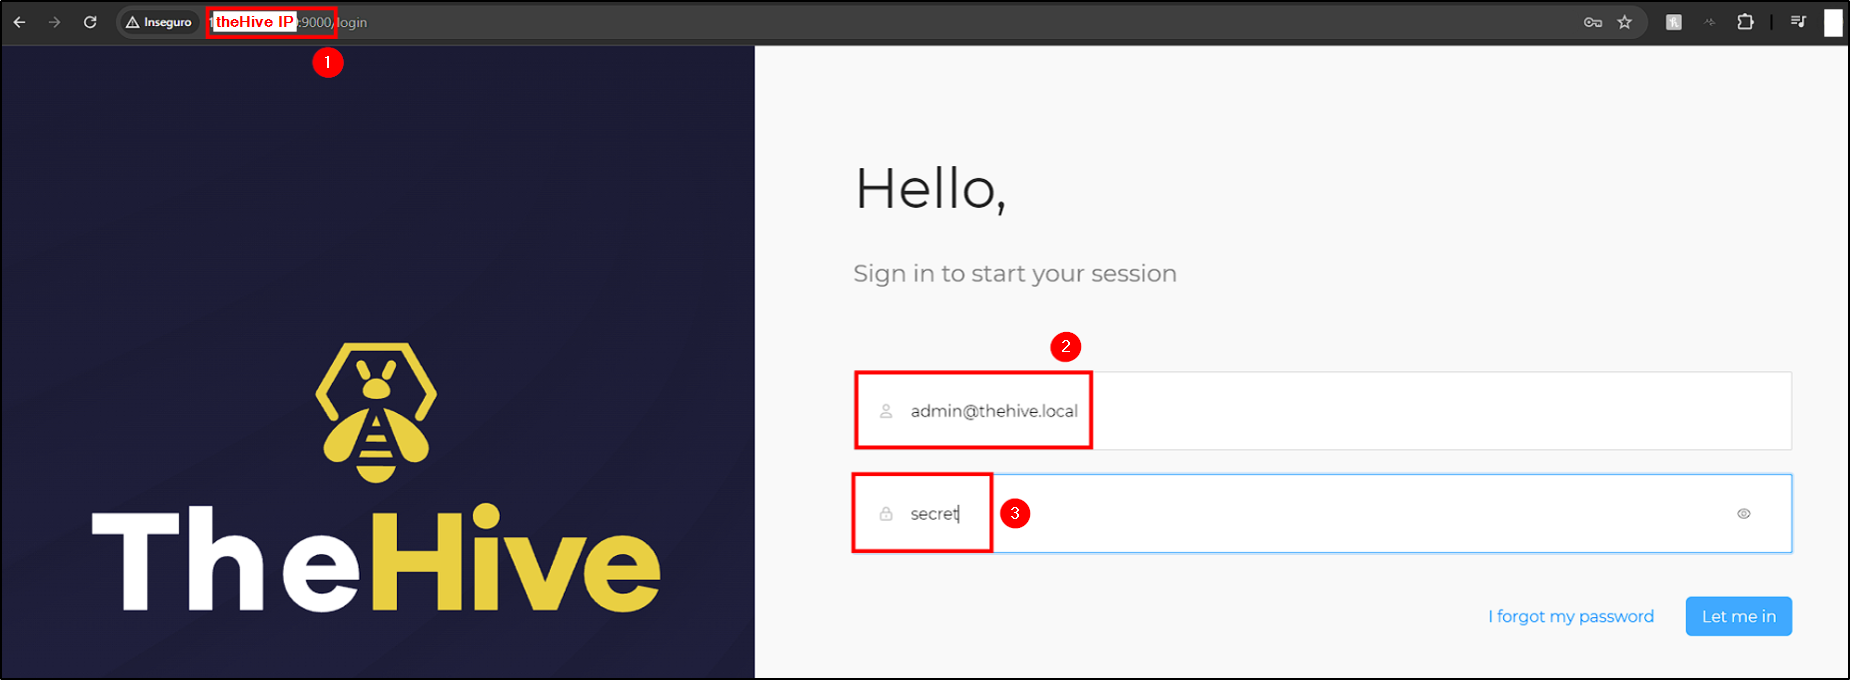
If all services are running and configured correctly, we should be able to access theHive web interface by navigating to https://"thehive_IP":9000. There, we will be presented with a login screen where we can enter the default credentials - [email protected]:secret
With this, our theHive installation and configuration is complete.
Authentication Error
If you can’t authenticate with theHive default credentials and your Elasticsearch is down, you will need to create a jvm.options file in the jvm.options.d/ folder. Java Virtual Machine (JVM) files are used to configure settings on Elasticsearch such as memory allocation, garbage collection, log settings, etc.
Do not modify the root
jvm.optionsfile. Use files injvm.options.d/instead.
To do this, use the following commands:
1
2
3
4
5
6
7
# Create jvm.options file
nano /etc/elasticsearch/jvm.options.d/jvm.options

# jvm.options content
-Dlog4j2.formatMsgNoLookups=true
-Xms2g
-Xmx2g
After this, restart Elasticsearch and the problem should be fixed.
Adding Agent to Wazuh
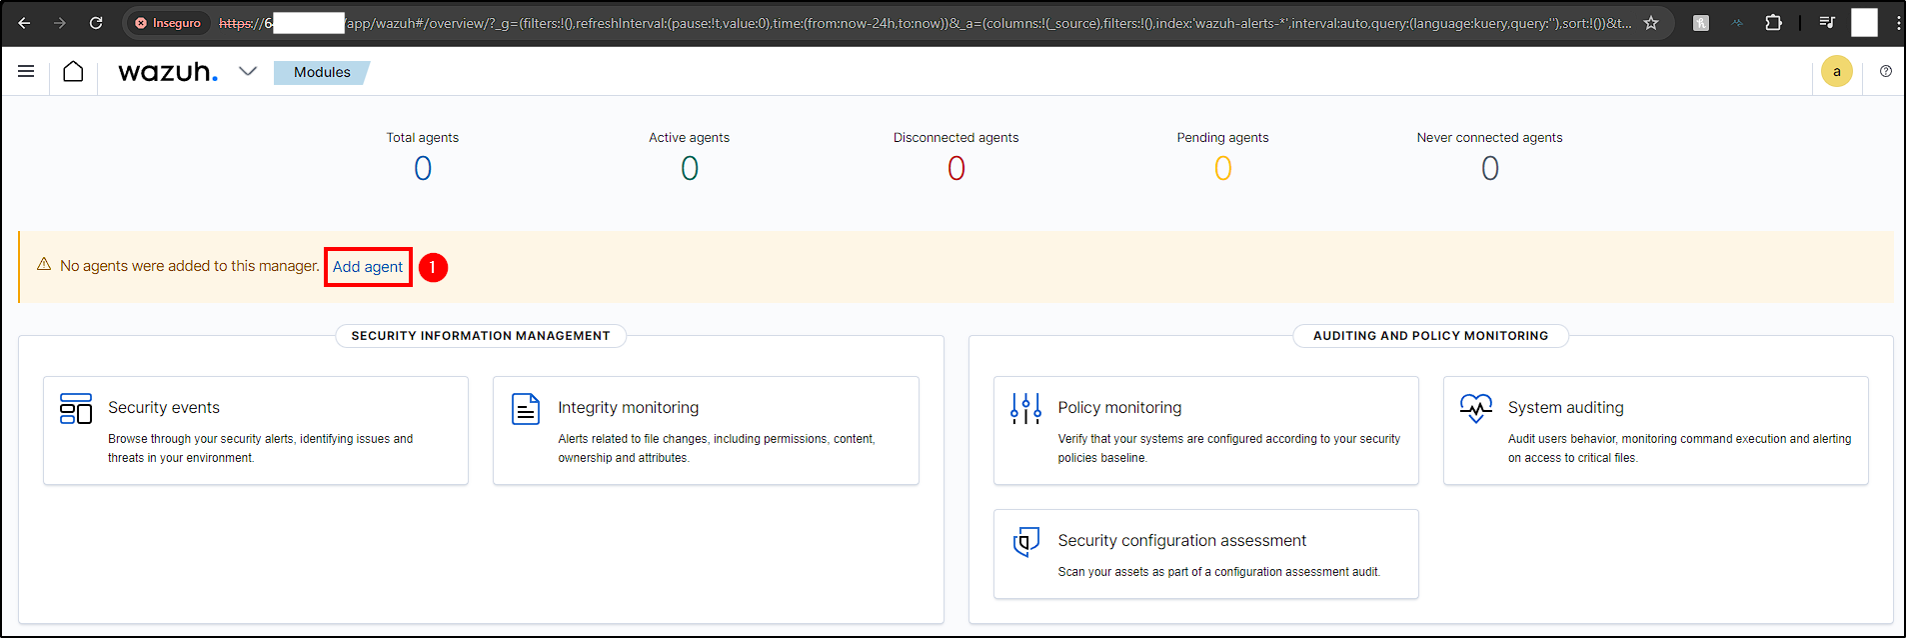
First, log into Wazuh’s manager on “https://”Wazuh_IP”, with the admin credentials we got from the installation.
If you don’t have the password, SSH into Wazuh server, extract the files from wazuh-install-files.tar with
tar -xvf wazuh-install-files.tarand check the file wazuh-passwords.txt.
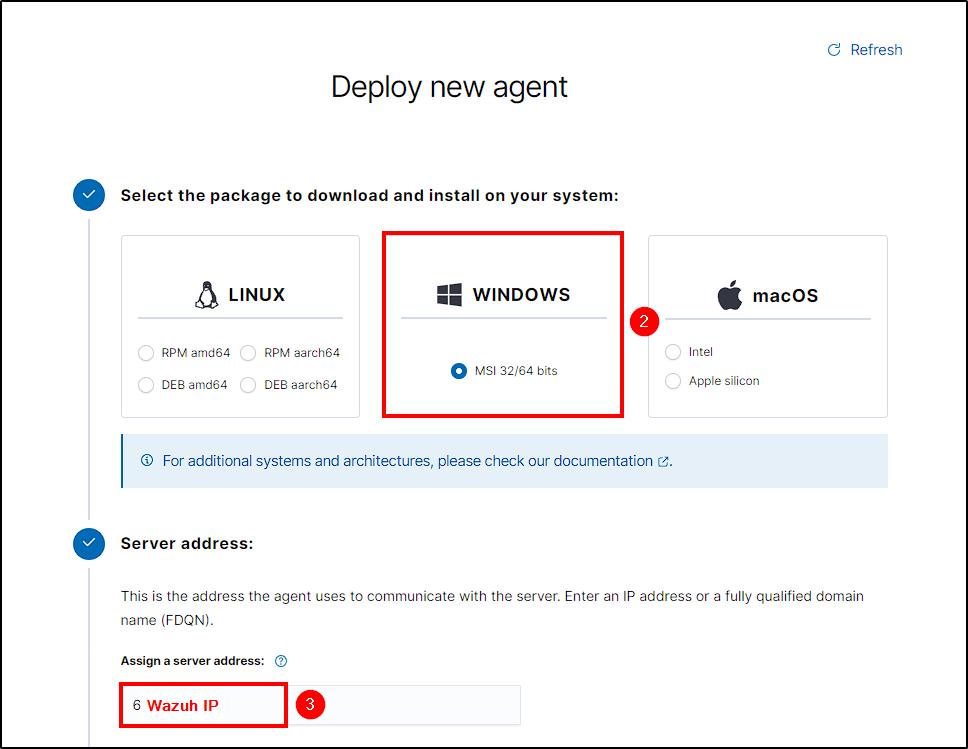
Next, select Add agent, your Agent OS and enter your Wazuh server IP.
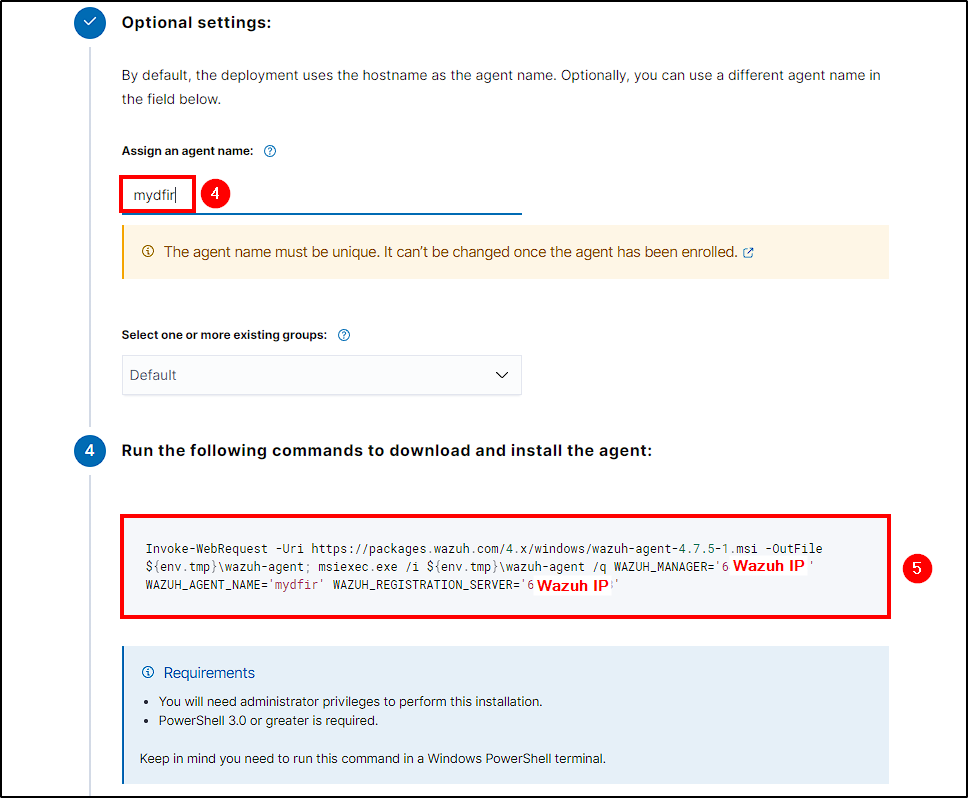
Name your agent and copy the command generated at step 4. This command will download and install the Wazuh agent software on your host, while configuring its server address and agent name.
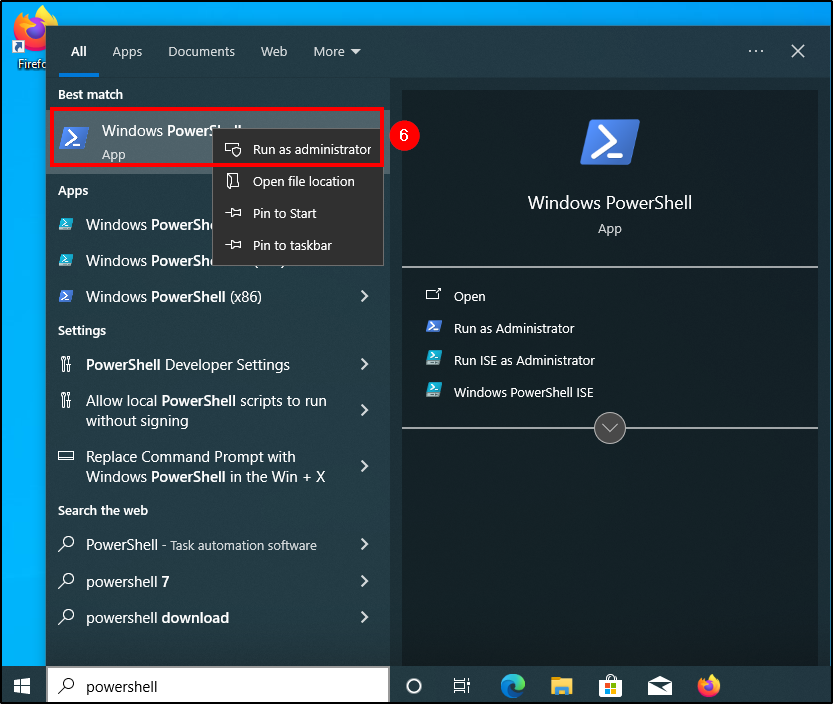
Power your Windows VM and start a poweshell terminal with admin rights. Insert the copied command and, after completing the download and installation, start Wazuh service with the following command:
1
net start wazuhsvc
If we go back to the Wazuh Manager dashboard and refresh it, we should see our new agent.
Now our agent is connected to Wazuh Manager and we can start to generate telemetry!
Next Steps
In the next module, we will generate telemetry between our Wazuh agent and server. Additionally, we will create a custom rule that will trigger an alert on Wazuh Manager every time Mimikatz.exe is detected on our agent.

