Honeypot Project - World Map of failed RDP attempts
Azure Sentinel Honeypot Monitoring Project
Summary
This lab’s purpose is to understand how to collect log data from RDP Brute Force attacks targetting our honeypot, query it in Azure Sentinel and display it in a manner that is easy to understand. Specifically, we’ll visualize the data on a world map by event count, using a PowerShell script to fetch the geolocation of attackers.
This build is inspired by Josh Makador’s project and the primary aim is to gain practical experience with a variety of Microsoft Azure resources such us Azure Sentinel, virtual machines and Log Analytics Workspaces.
Overview
Components
- Honeypot - Windows 10 VM hosted in Microsoft Azure;
- Third Party API: IP2Location.io;
- Log Analytics Workspace (for storing logs) and Azure Sentinel (SIEM).
Diagram
Microsoft Azure subscription and Setting up VM
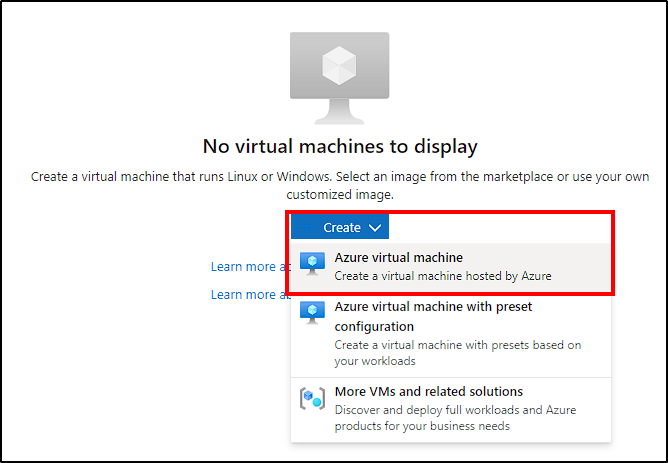
To begin, create a free Azure account by providing the necessary details, which comes with $200 worth of free credits for 30 days. After creating the account, access the Azure Portal and follow these steps to create a new Virtual Machine:
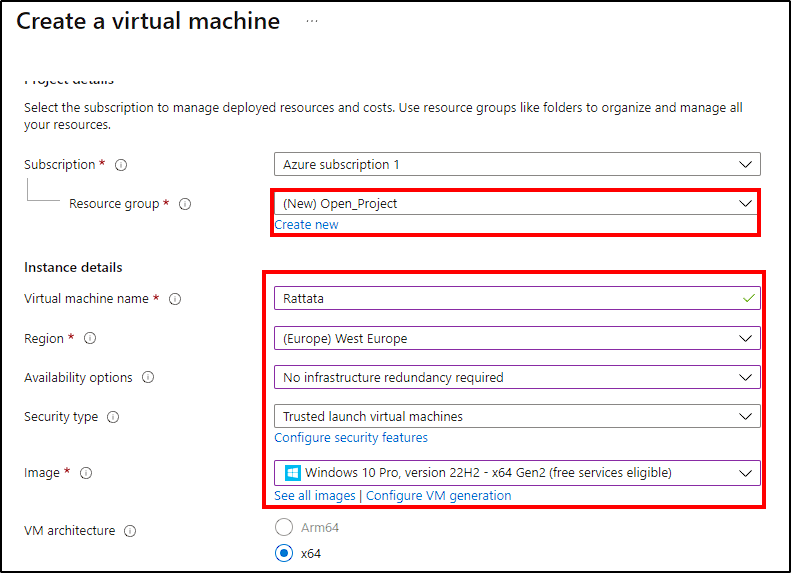
VM Creation Configurations:
- Subscription: Select your free subscription;
- VM Name: Name your VM (p.e. Rattata);
- Region: Select the nearest region to you for better performance;
- Image: Choose a Windows 10 VM.
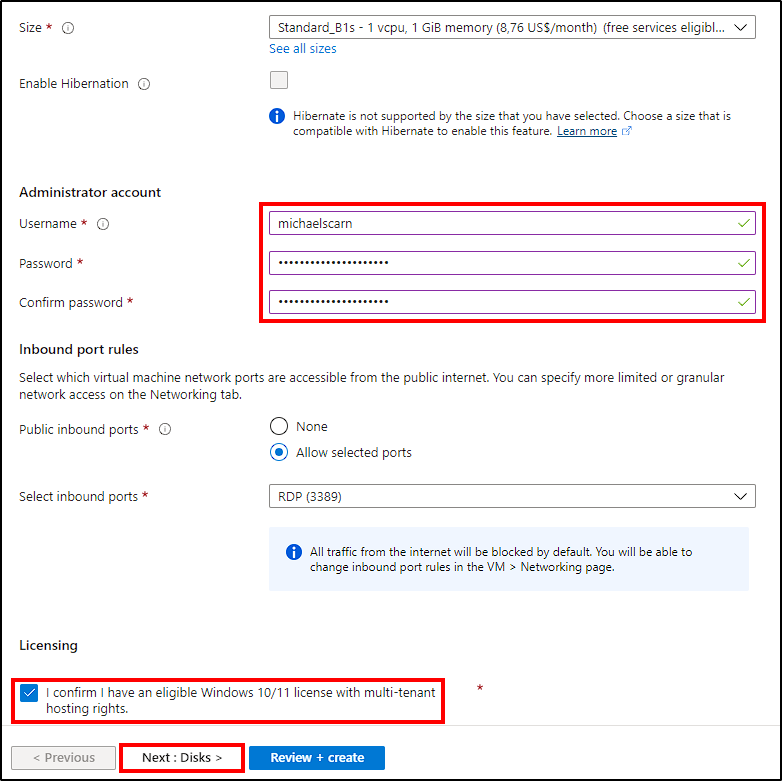
- Size: The size doesn’t really matter for this project, the default option is enough.
- Administrator Account: Set up an administrator account with a username and password. Ensure the password is strong enough so it can’t be easily brute forced.
- Inbound ports: Under
Inbound port rules, chooseAllow selected portsand select RDP (port 3389).
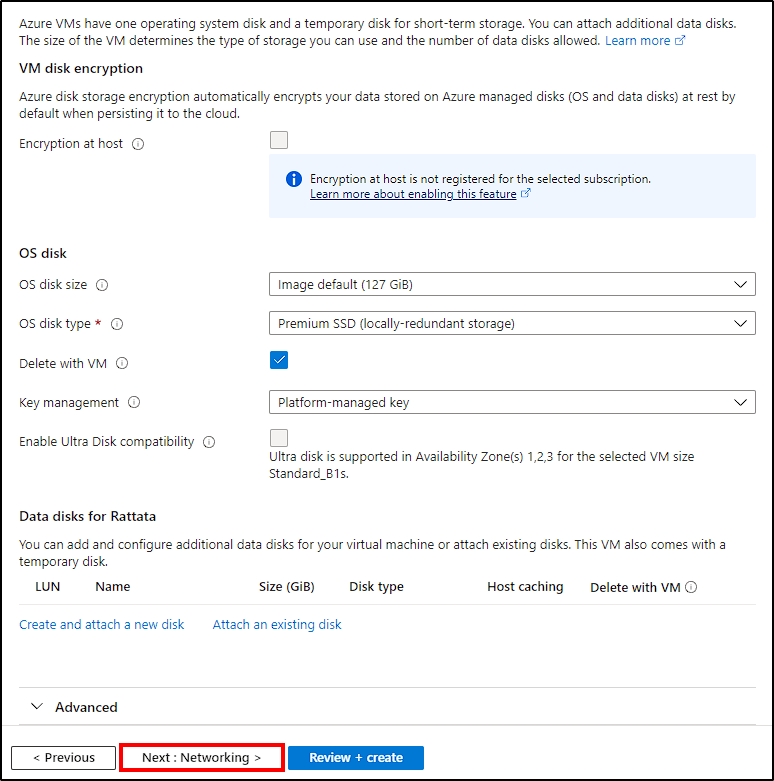
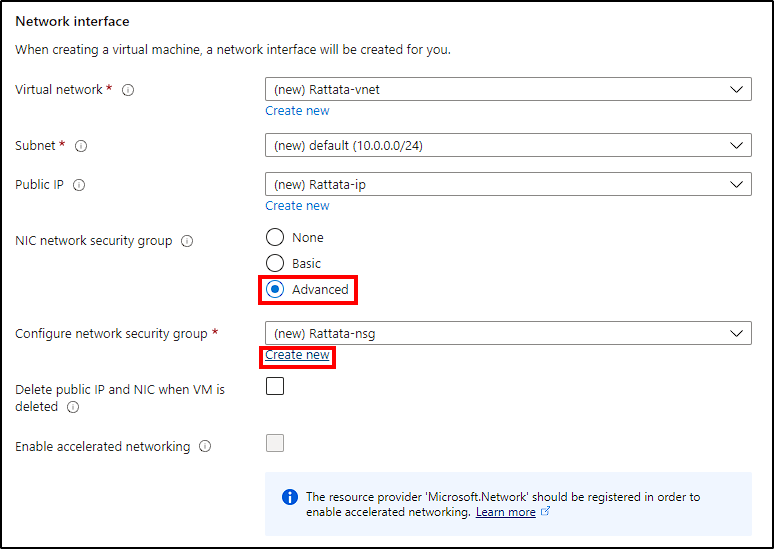
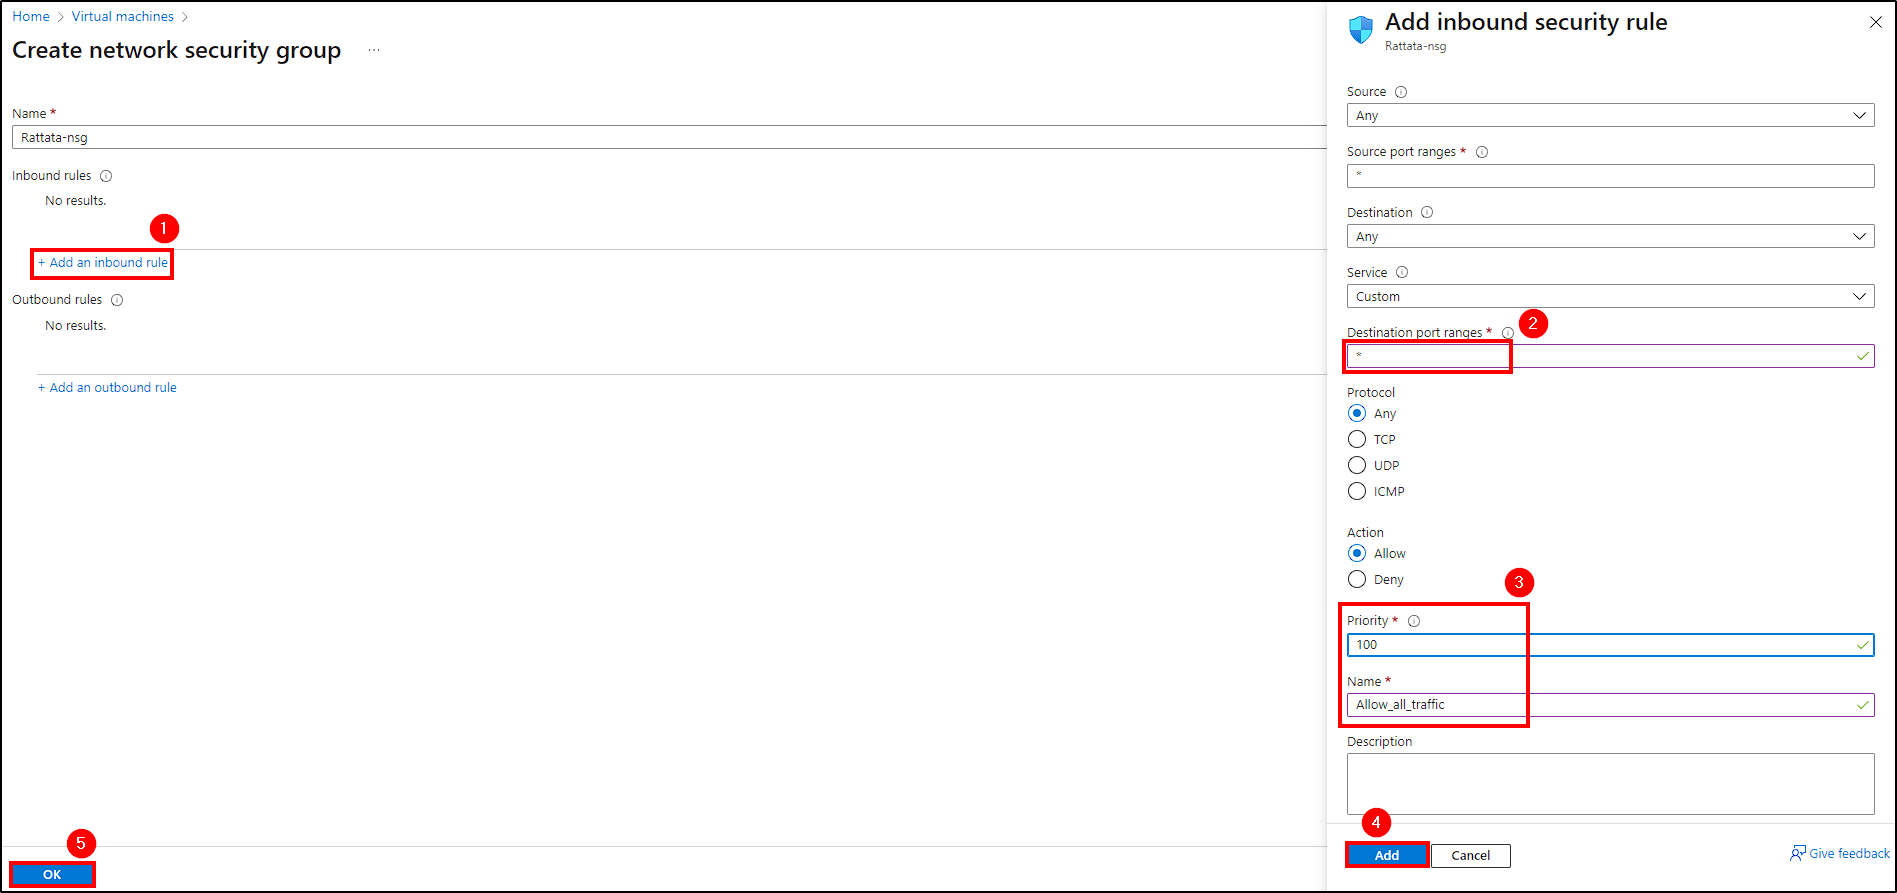
- Networking: Change the security group to allow all inbound traffic like in the picture below.
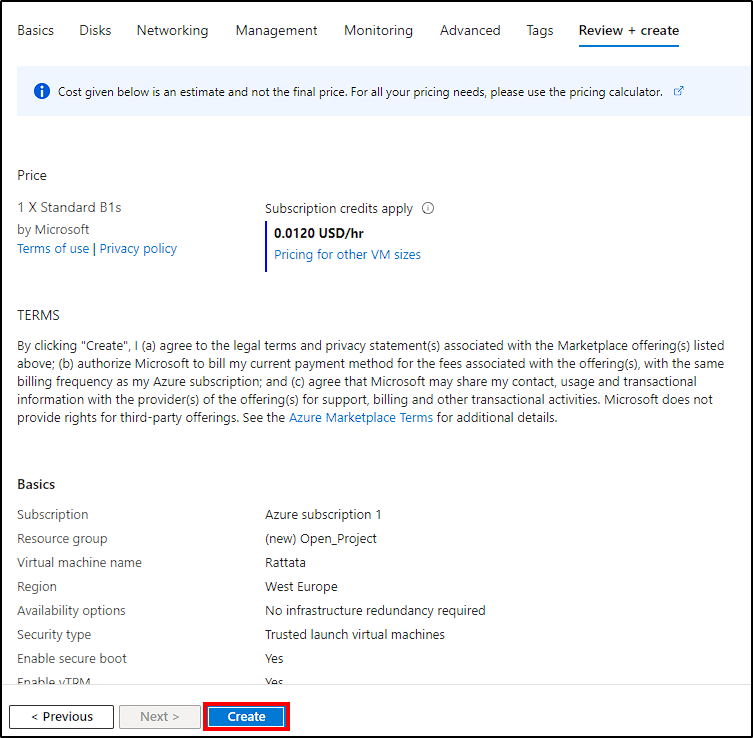
After configuring these settings, create your VM.
Disabling the Firewall in the Virtual Machine
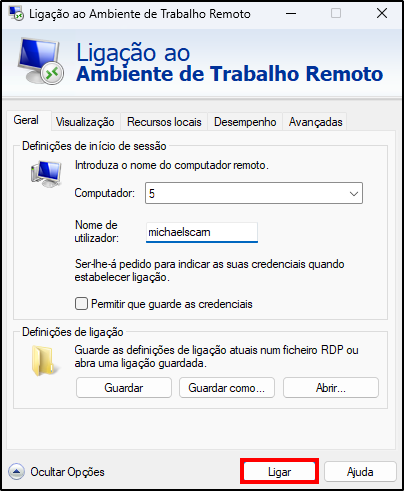
To enable attackers to discover and ping our machine, we need to disable the VM’s firewall. Use the public IP address (available on the VM overview from Azure Portal) to access it via Remote Desktop Protocol (RDP) with your administrator credentials.
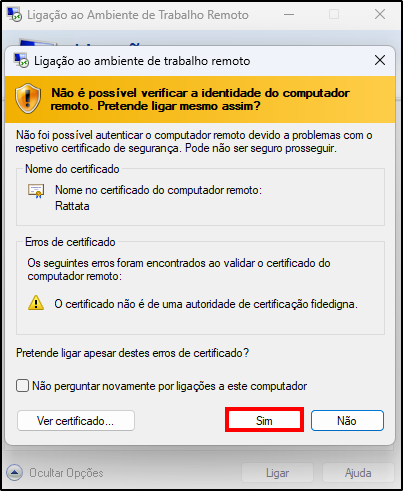
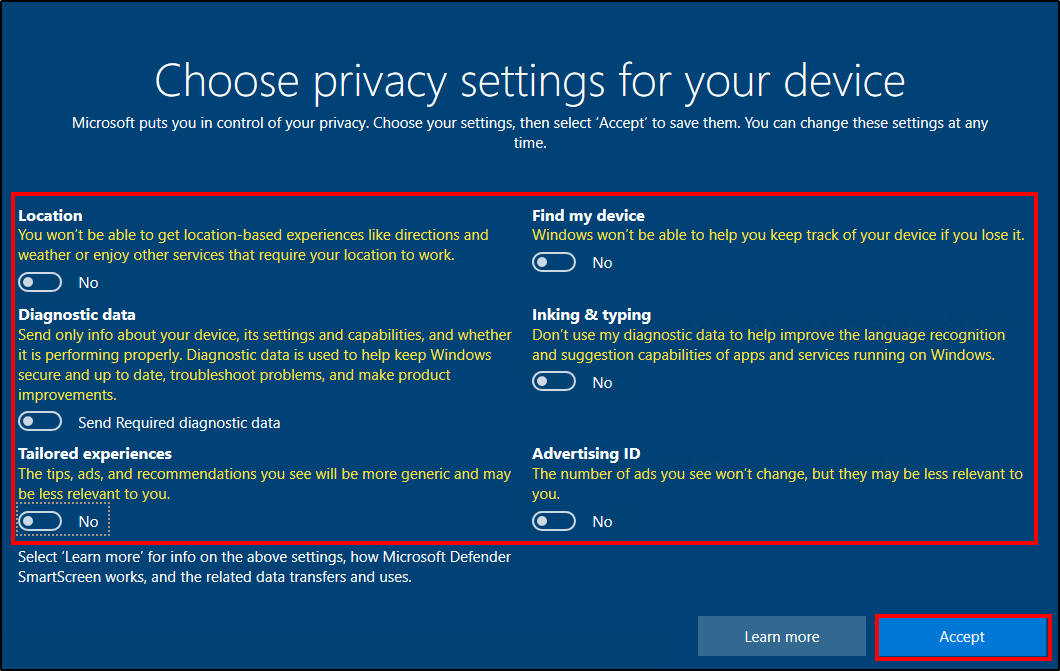
Accept the certificate warning and complete Windows installation by selecting No to all privacy settings.
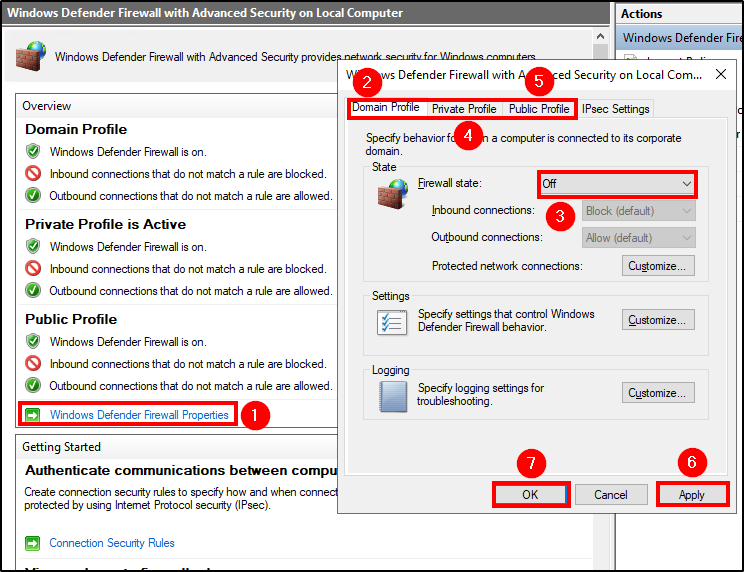
To disable the Windows Firewall, search for wf.msc, click on Windows Defender Firewall Properties and turn the Firewall State to Offon the Domain, Private and Public profiles. Hit Apply and Ok to confirm the changes.
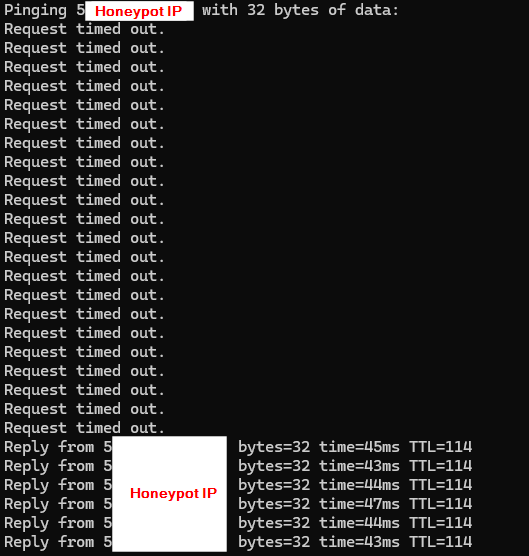
Now our VM is visible to external pings, increasing its likelihood of getting discovered by scanners.
Setting Up Log Analysis and Data Collection
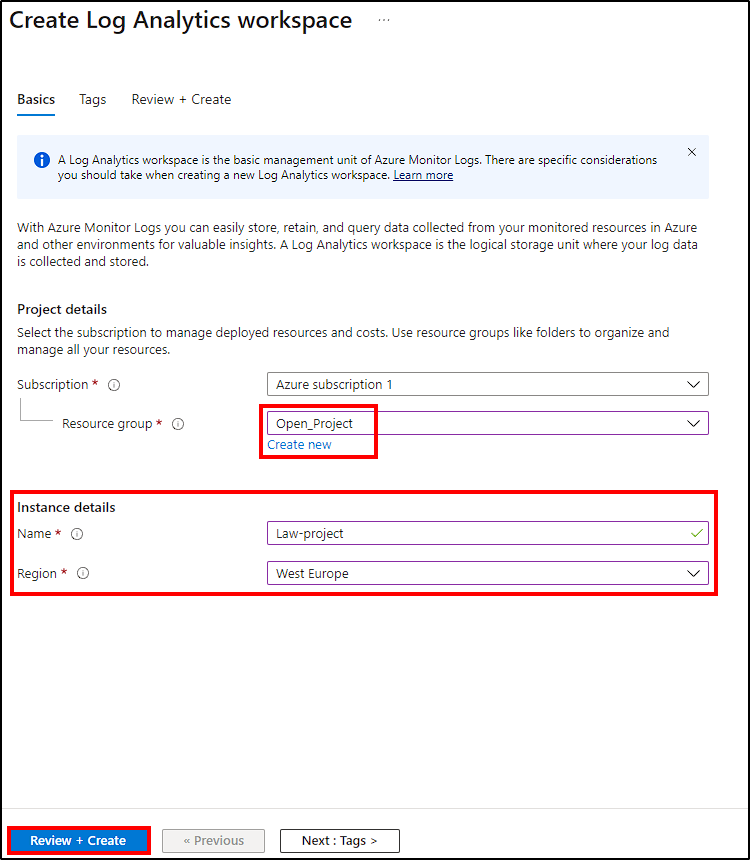
In the Azure Portal, search for Log Analytics workspace and select Create Log Analytics workspace to create a new workspace. Next, make the following changes:
- Select the same resource group as your VM;
- Name it and select the right region;
- Select
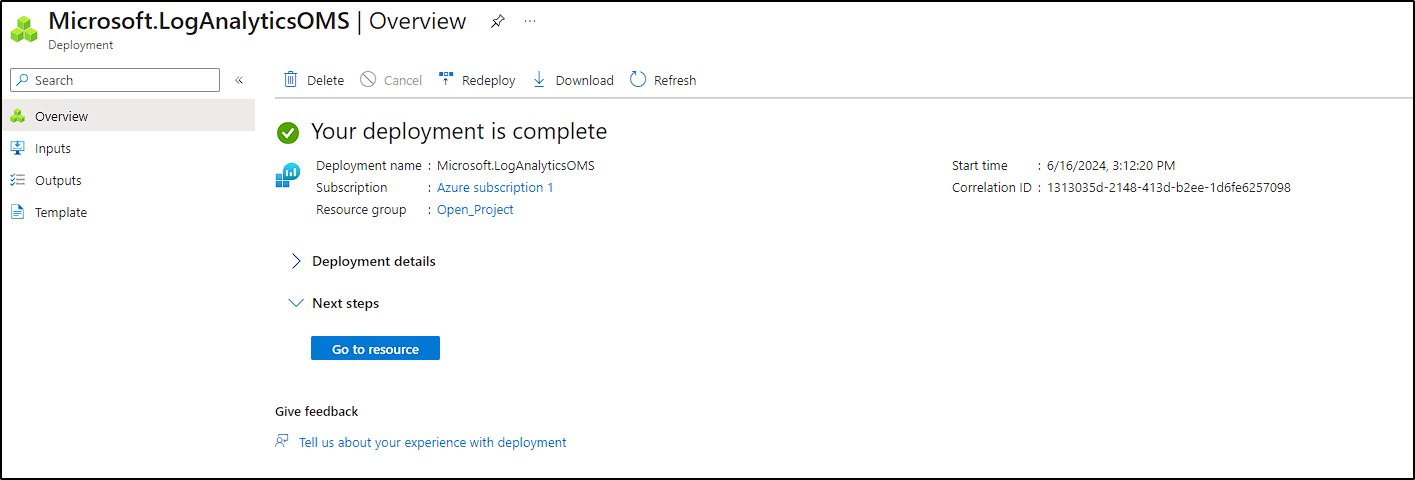
Review + Createto create our Log Analytics Workspace.
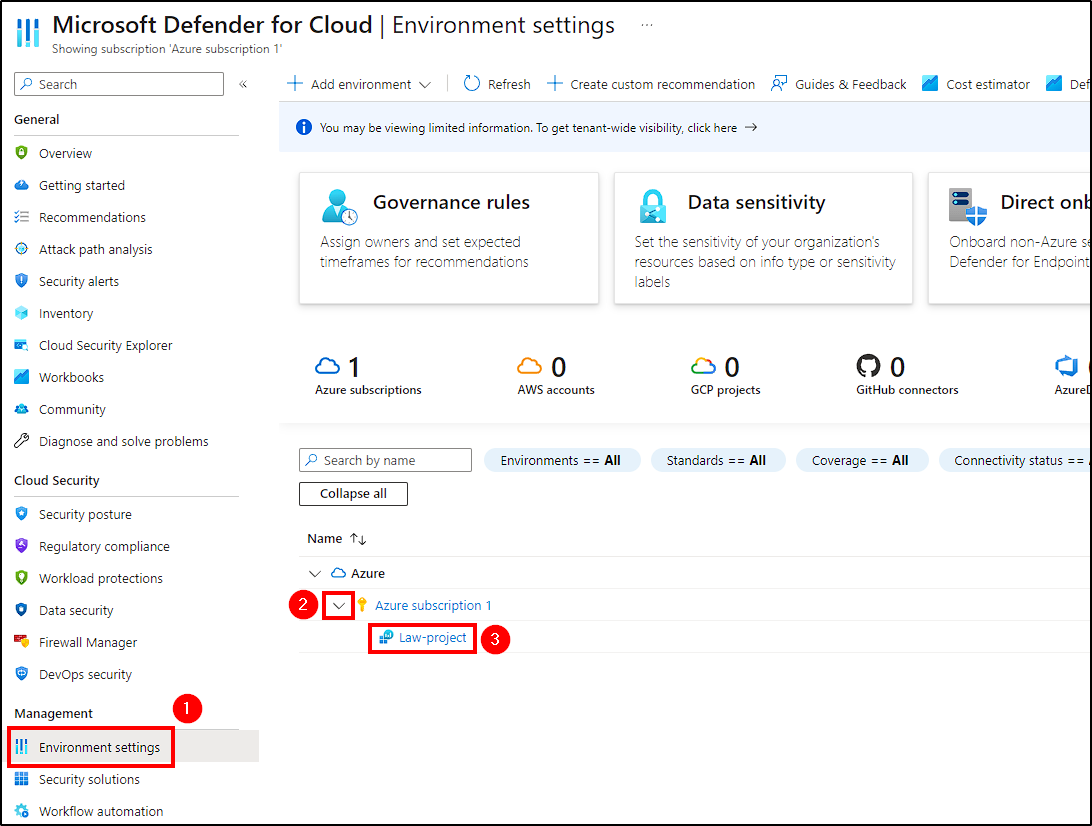
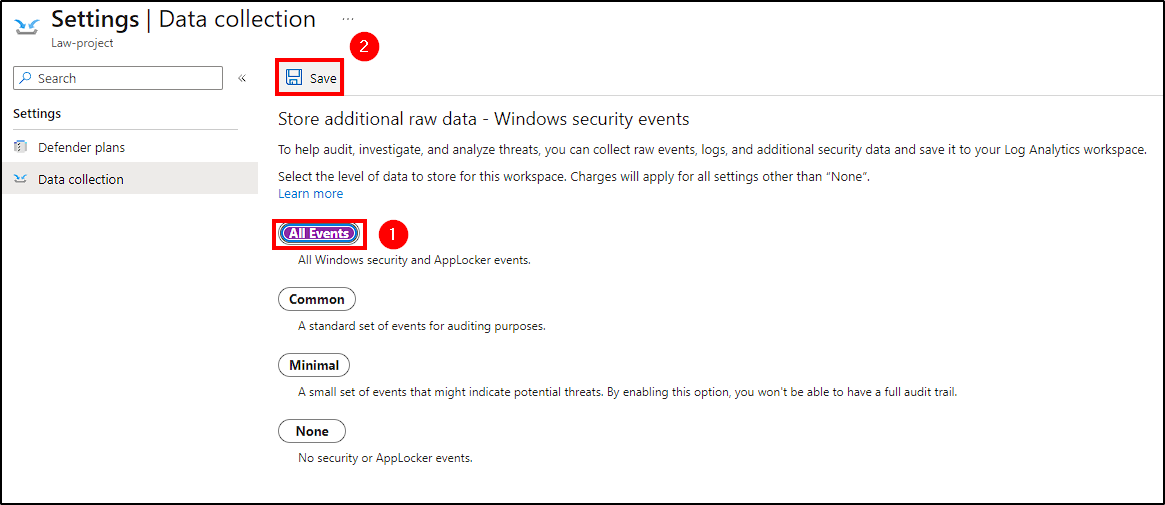
To send all Event Viewer logs from our VM to the Log Analytics workspace, go to Microsoft Defender for Cloud in the Azure Portal. Under Environment Settings > Subscription > Log Analytics Workspace created, activate the Server Defender plan and choose to store all events under the Data Collection tab.
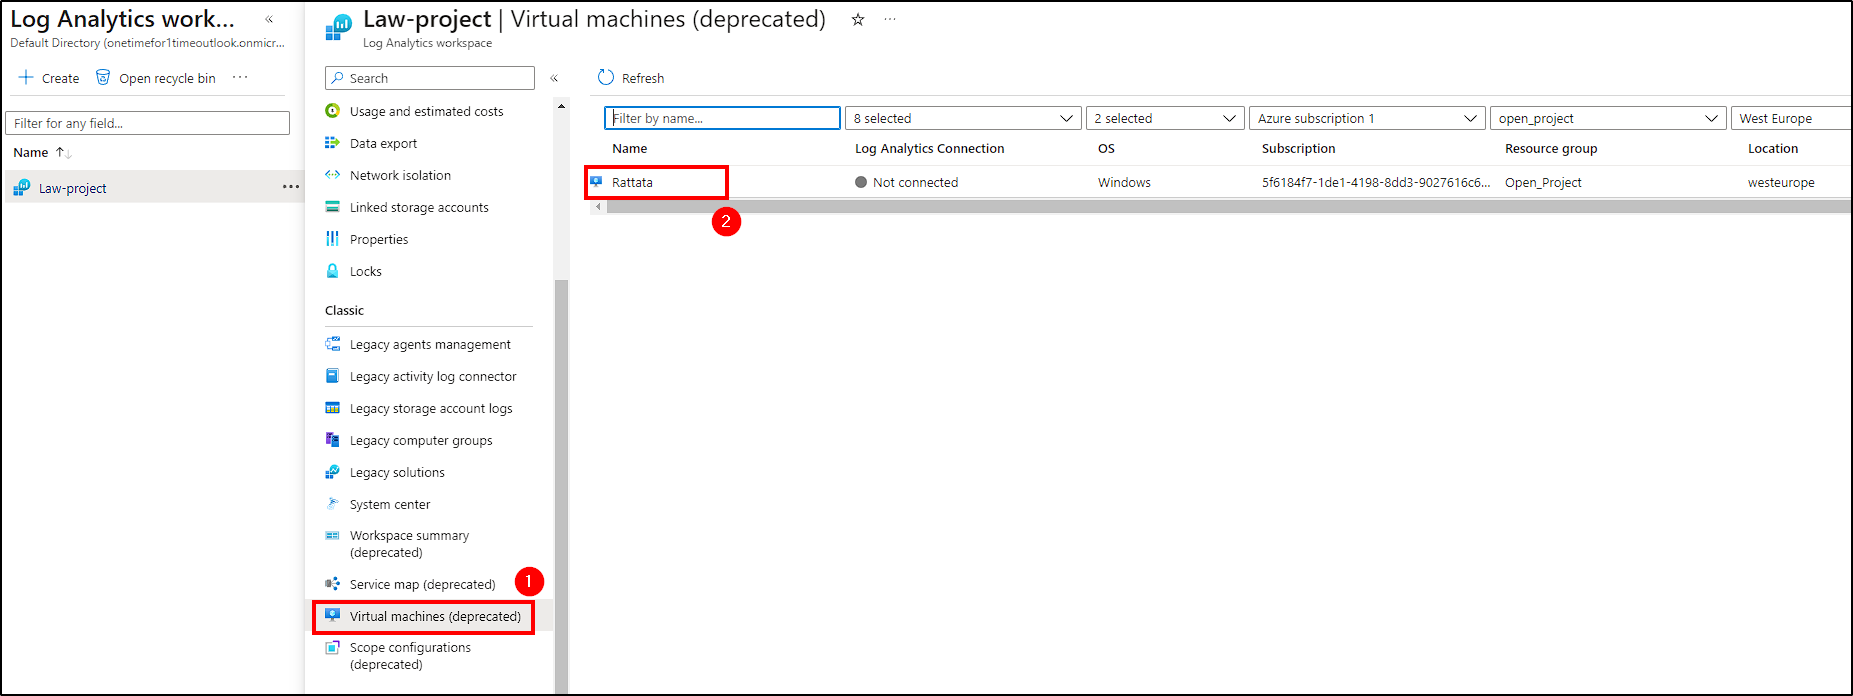
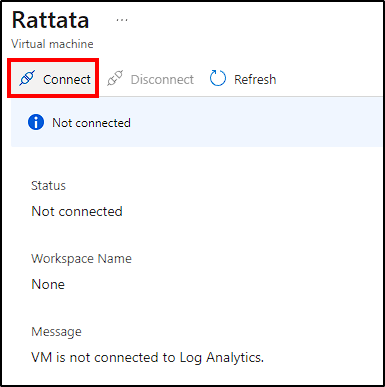
Finally, the last step is to connect our VM to the Log Analytics Workspace. Navigate to the Log Analytics default directory, select the one we created for this project and go to Virtual Machines > Honeypot VM > Connect.
Now, Log Analytics will ingest all events from our VM.
Integrating Azure Sentinel (SIEM)
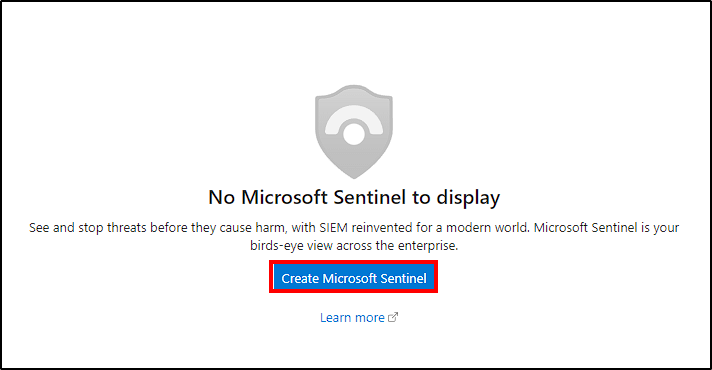
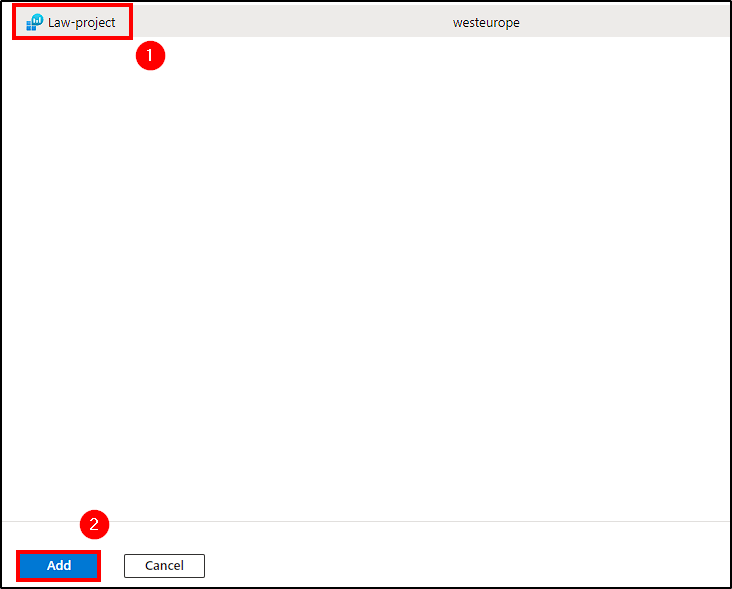
The next step is to analyze and visualize cyber-attack data using Azure Sentinel capabilities. To do this, search for Microsoft Sentinel and select Create Microsoft Sentinel > Our Log Analytics Workspace > Add.
Now we can visualize data from the VM’s logs in Azure Sentinel.
Creating our Custom Logs with Geolocation
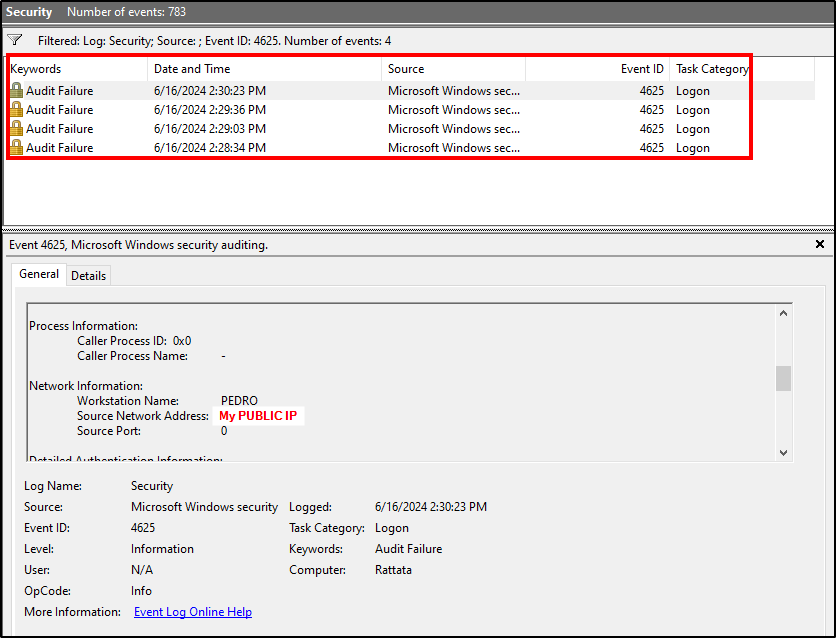
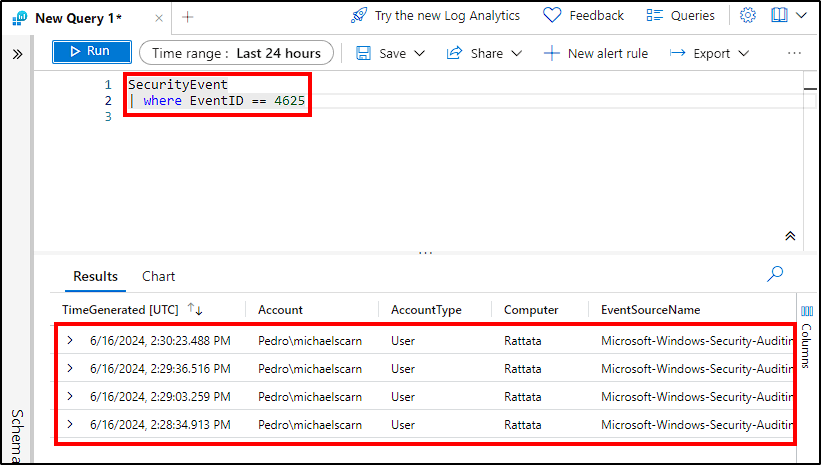
At this stage we are already able to visualize data from failed RDP attempts against our VM, by querying for 4625 events on Sentinel.
These 4 failed RDP attempts were for testing purposes.
However, our objective is to visualize that data on a world map. To do this, we’ll use a PowerShell script to fetch the geolocation of attackers via the IP2Location API.
On Josh’s video he used another API, which gives you 1000 queries for free. While looking for similar APIs, I found IP2Location that offers 30k queries for a free subscription, that lasts 7 days (make an account here). With that, I made some small changes on the powershell script that you can find on my github.
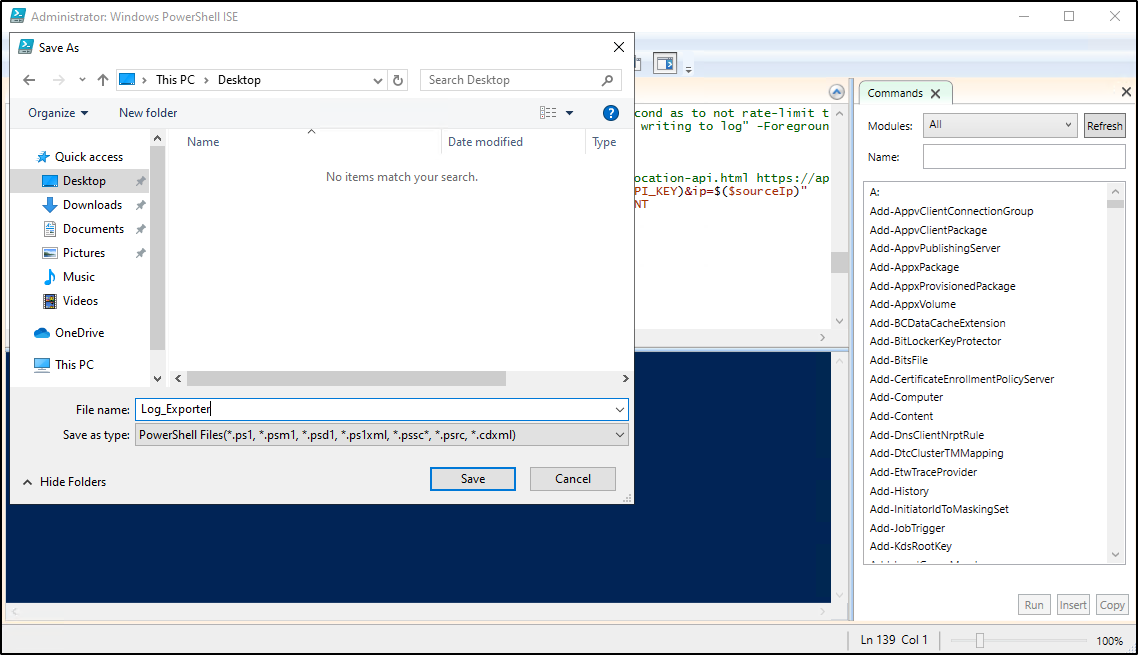
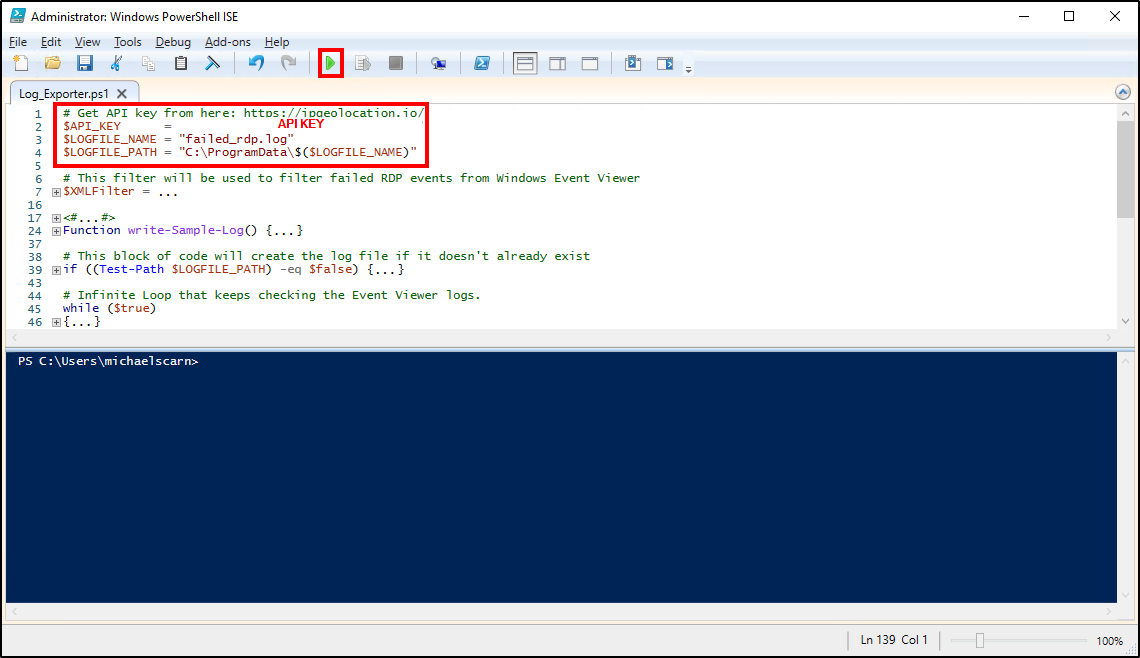
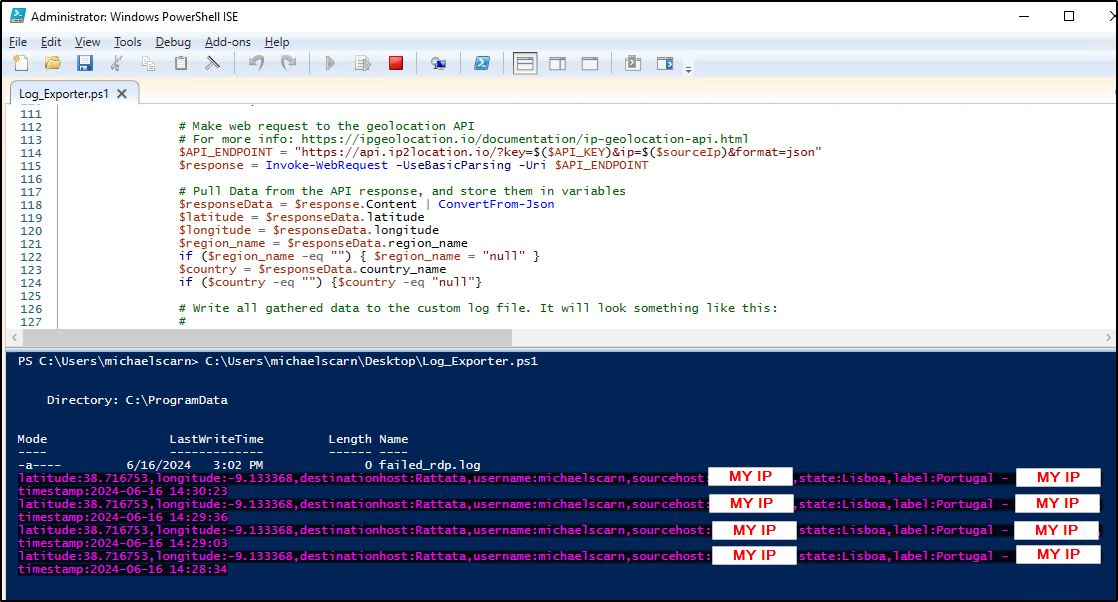
First, in the VM, open a Powershell ISE terminal and create a new script. Next, copy the custom script (get it here) and paste it on powershell. Make sure to replace the “CHANGE_ME” field with your API key, and save it.
Running the script will create a log file (C:\ProgramData\failed_rdp.log) with the geolocation data from all failed RDP attempts.
Extracting & Visualizing Attack Data
Creating Custom Log in Log Analytics Workspace
Before jumping to Sentinel and create our map, we first need to create a custom log on Log analytics with the content of the failed_rdp.log file from the VM. To do this, copy the file and save it on your host in order to upload it to Azure.
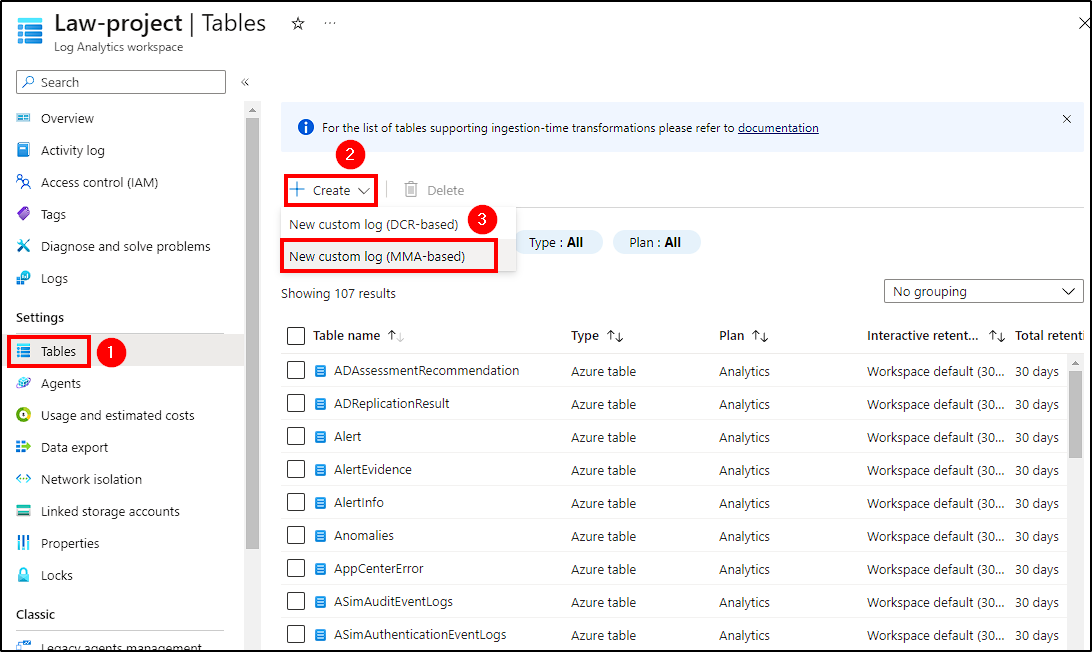
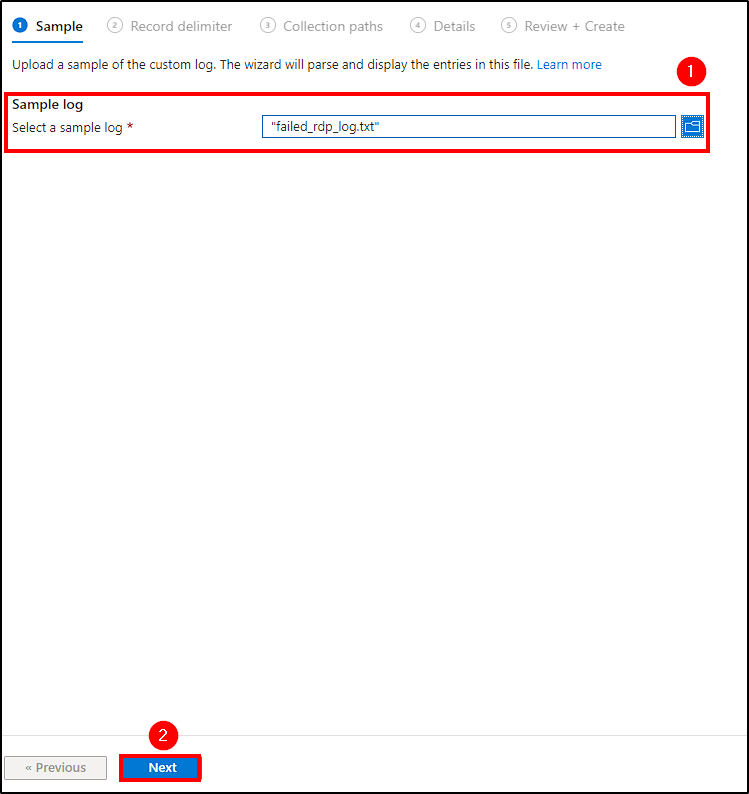
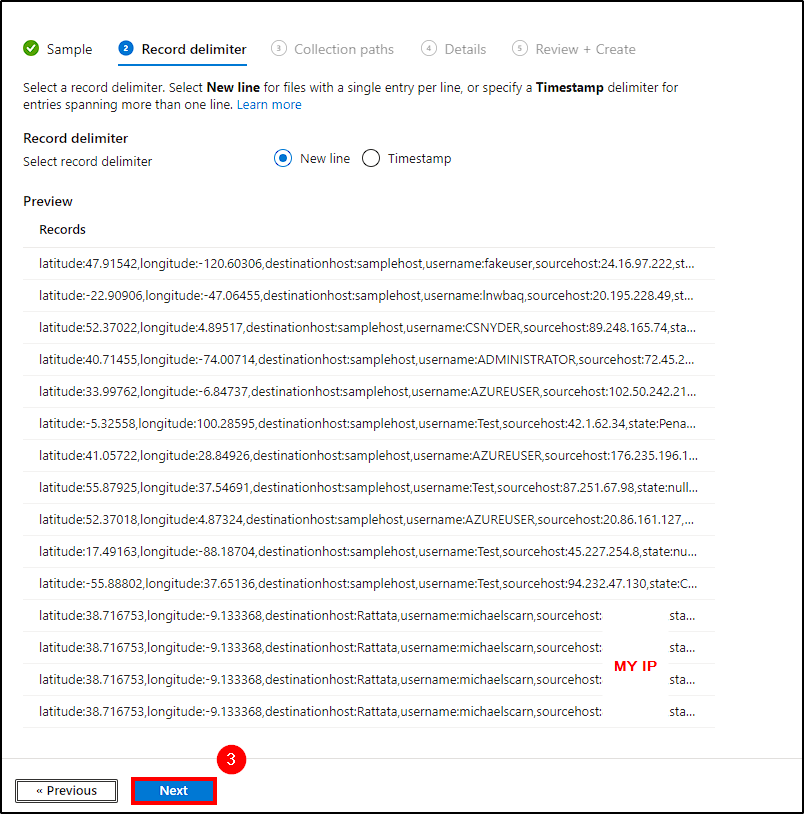
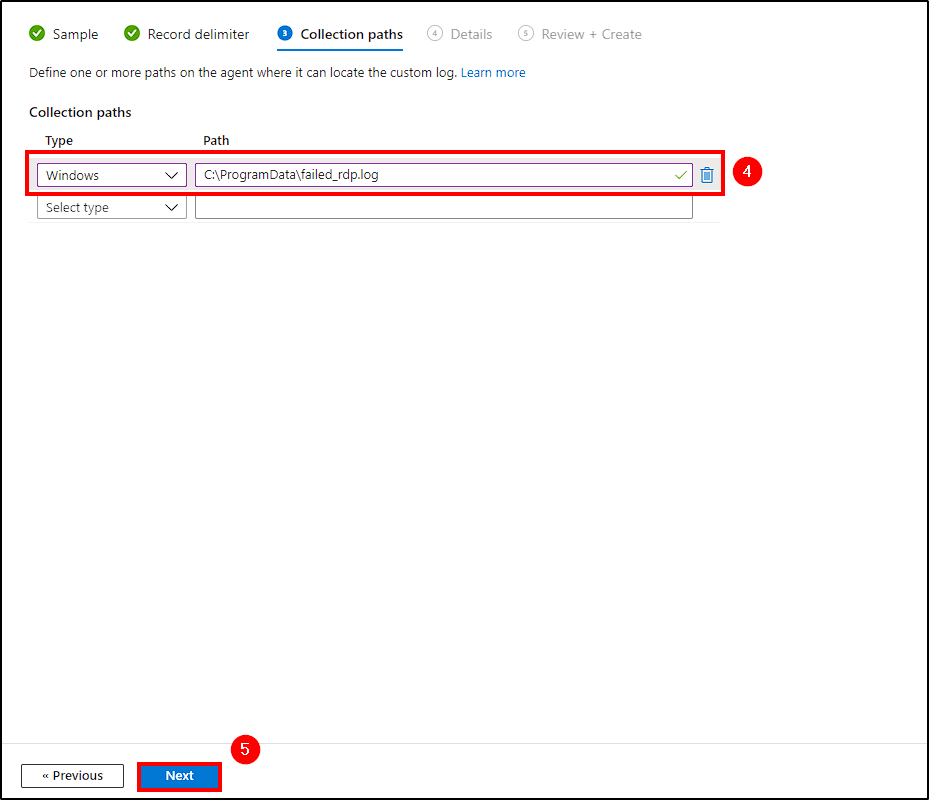
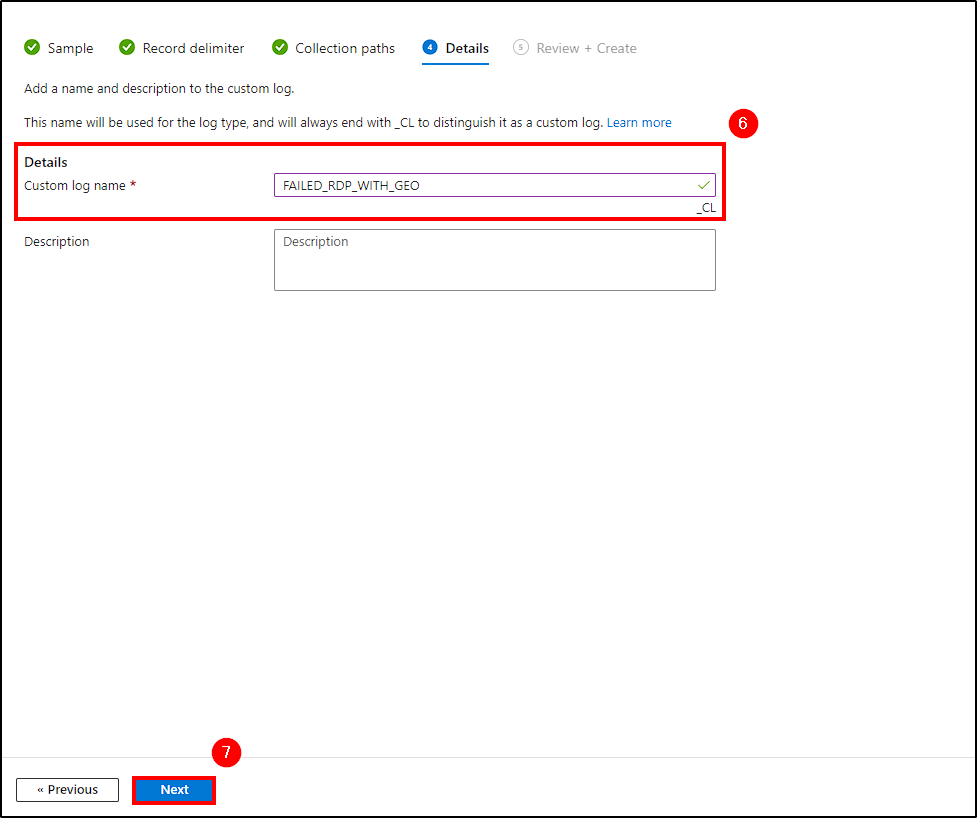
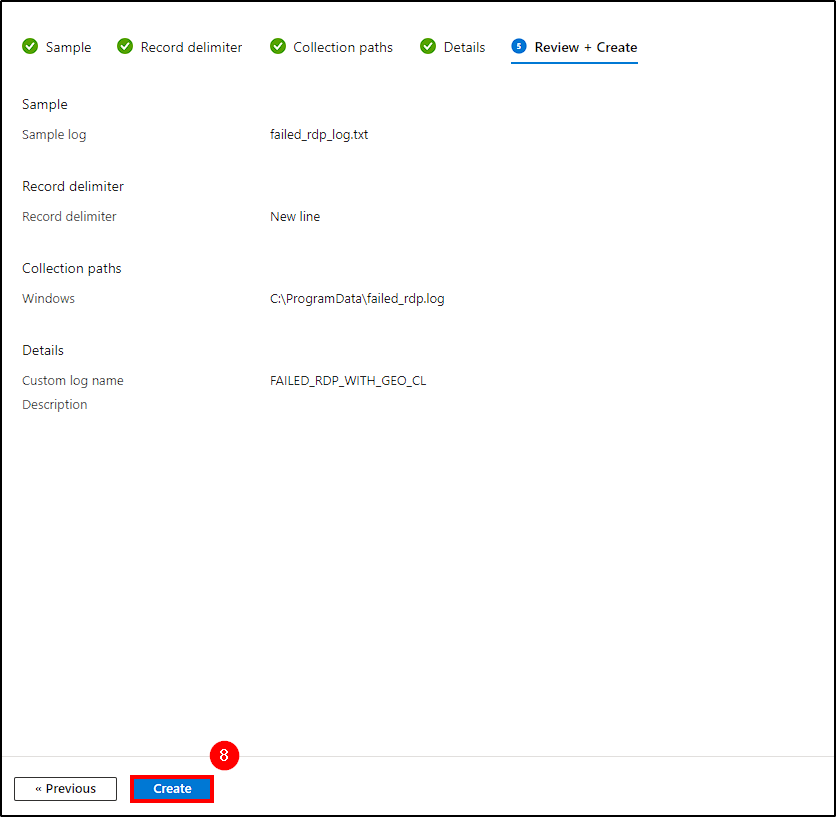
Next, head back to the Log Analysis Dashboard on Azure and click on Tables > Create > New custom log (MMA-based) to create our custom log. There, make the following changes:
- Sample: Select the log copy saved on our host;
- Record delimiter: Hit Next;
- Collection paths:
- Type:
Windows; - Path:
C:\ProgramData\;
- Type:
- Details: Name it. You can give it a description as well (optional)
- Select
Create.
Ensure the Path is correct, as these logs will be ingested by Log Analytics and used to create our map!
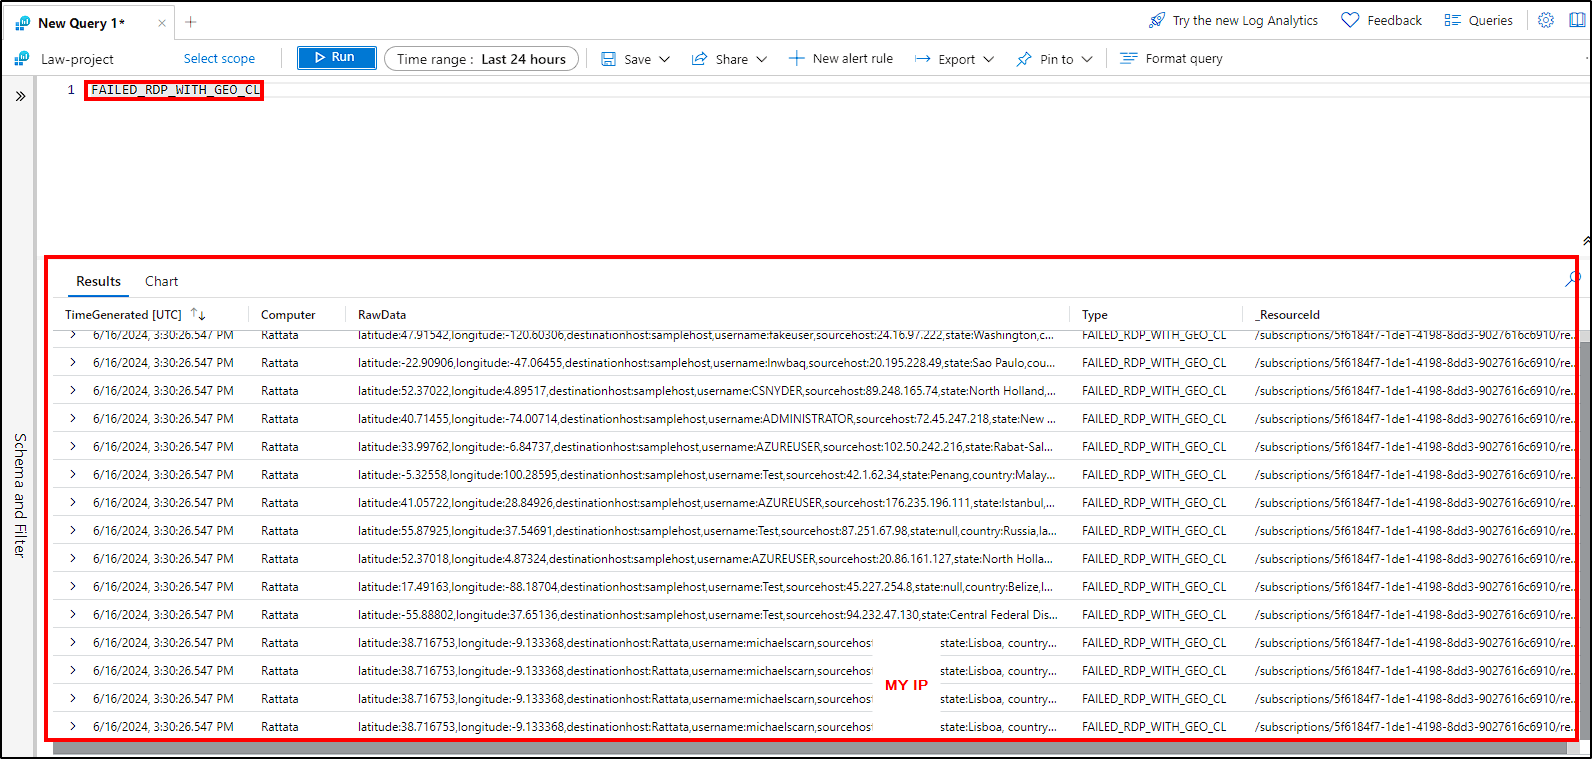
Now, we are able to query the data from the custom log on Azure. To do this, just navigate to Logs inside our Log Analytics workspace, and query the created custom log.
It may take some time for Azure to sync the VM with Log Analytics, so be patient (it took me around 15/20 minutes).
Extracting Fields from Custom Log
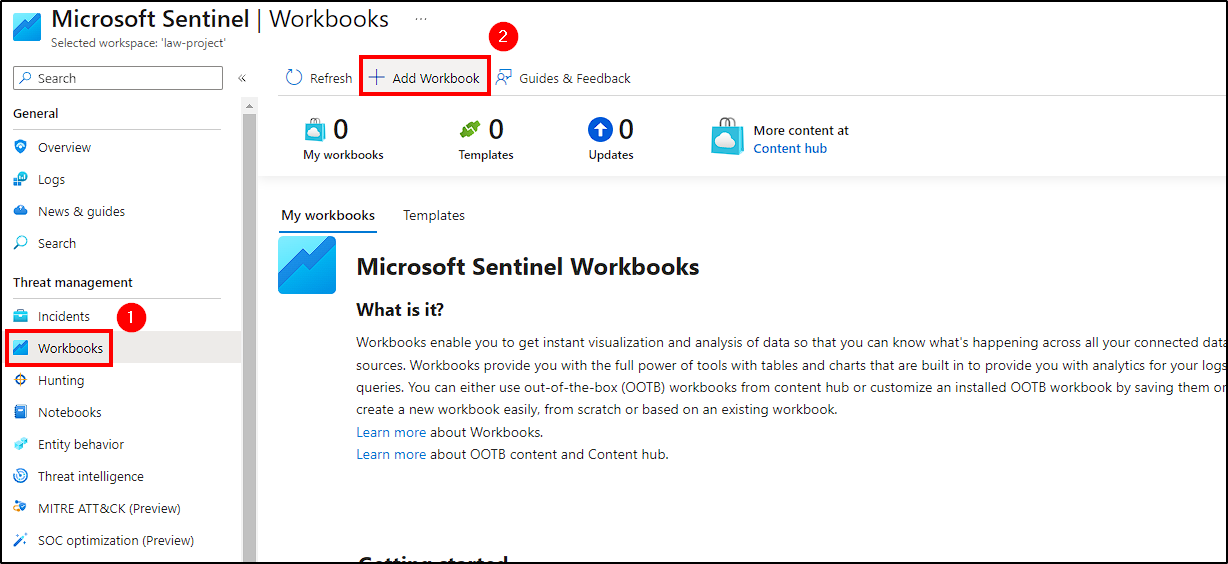
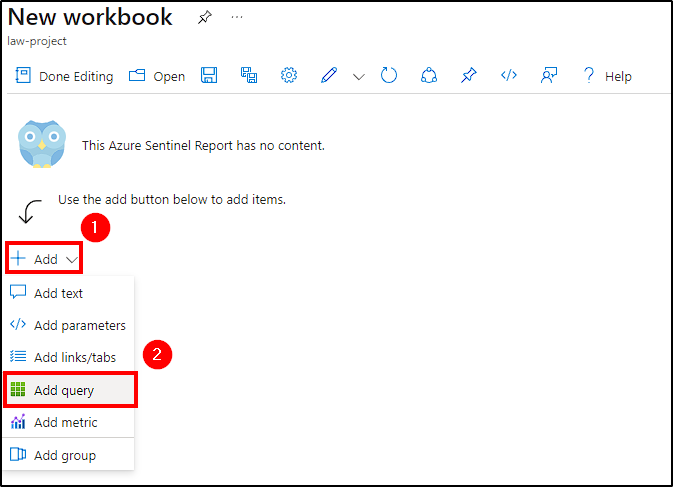
The RawData within the log contains information such as latitude, longitude, destinationhost, etc; that we need to extract in order to create our world map. To achieve this, navigate to Workbooks in Azure Sentinel panel and create a new workbook by selecting Add Workbook > Add > Add query.
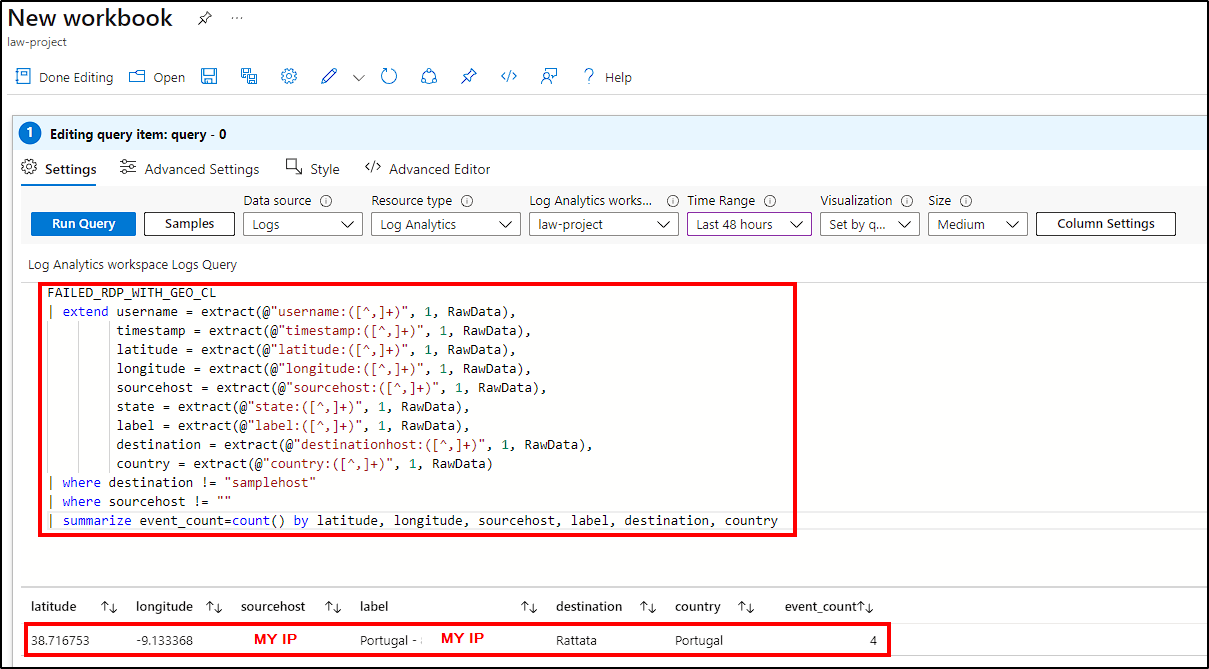
Next, paste the following KQL script that will extract the desired data from the custom logs (as well as removing the sample logs that come with the powershell script).
1
2
3
4
5
6
7
8
9
10
11
12
13
14
-- Change "FAILED_RDP_WITH_GEO_CL" to your Custom Log name
FAILED_RDP_WITH_GEO_CL
| extend username = extract(@"username:([^,]+)", 1, RawData),
         timestamp = extract(@"timestamp:([^,]+)", 1, RawData),
         latitude = extract(@"latitude:([^,]+)", 1, RawData),
         longitude = extract(@"longitude:([^,]+)", 1, RawData),
         sourcehost = extract(@"sourcehost:([^,]+)", 1, RawData),
         state = extract(@"state:([^,]+)", 1, RawData),
         label = extract(@"label:([^,]+)", 1, RawData),
         destination = extract(@"destinationhost:([^,]+)", 1, RawData),
         country = extract(@"country:([^,]+)", 1, RawData)
| where destination != "samplehost"
| where sourcehost != ""
| summarize event_count=count() by latitude, longitude, sourcehost, label, destination, country
The code block above is for SQL, however Azure uses Kusto Query Language (KQL)! As rouge doesn’t support KQL I left it as SQL.
Visualizing Real-Time Brute Force Attacks
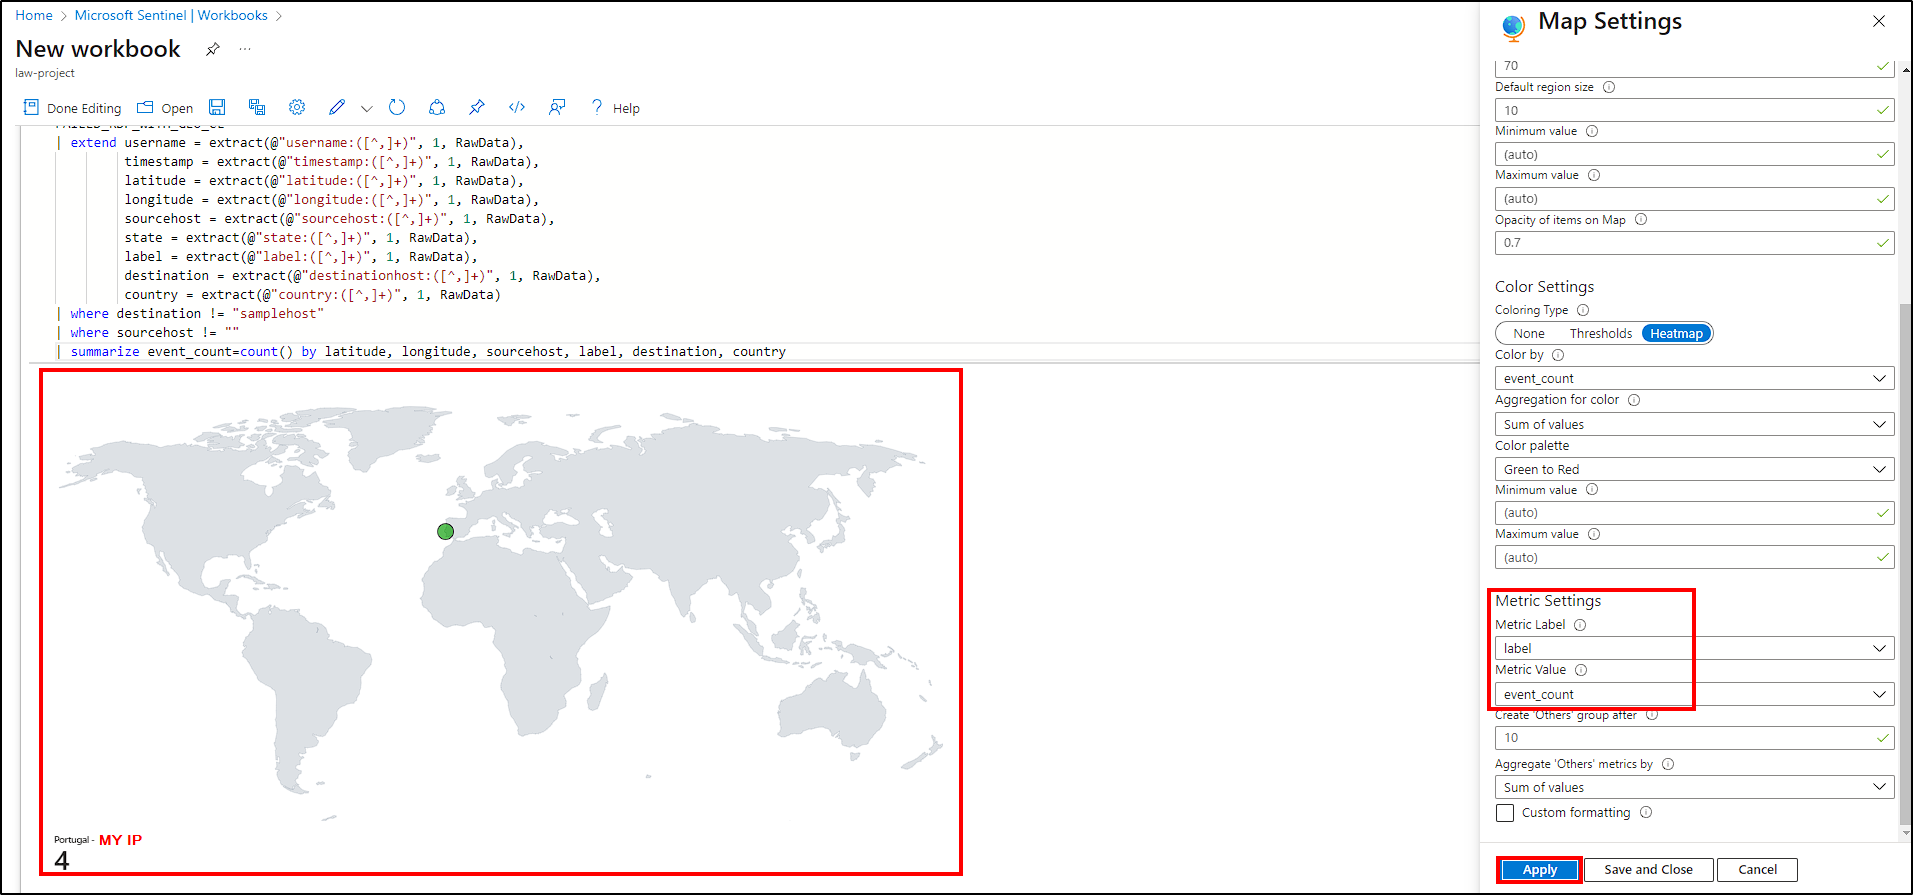
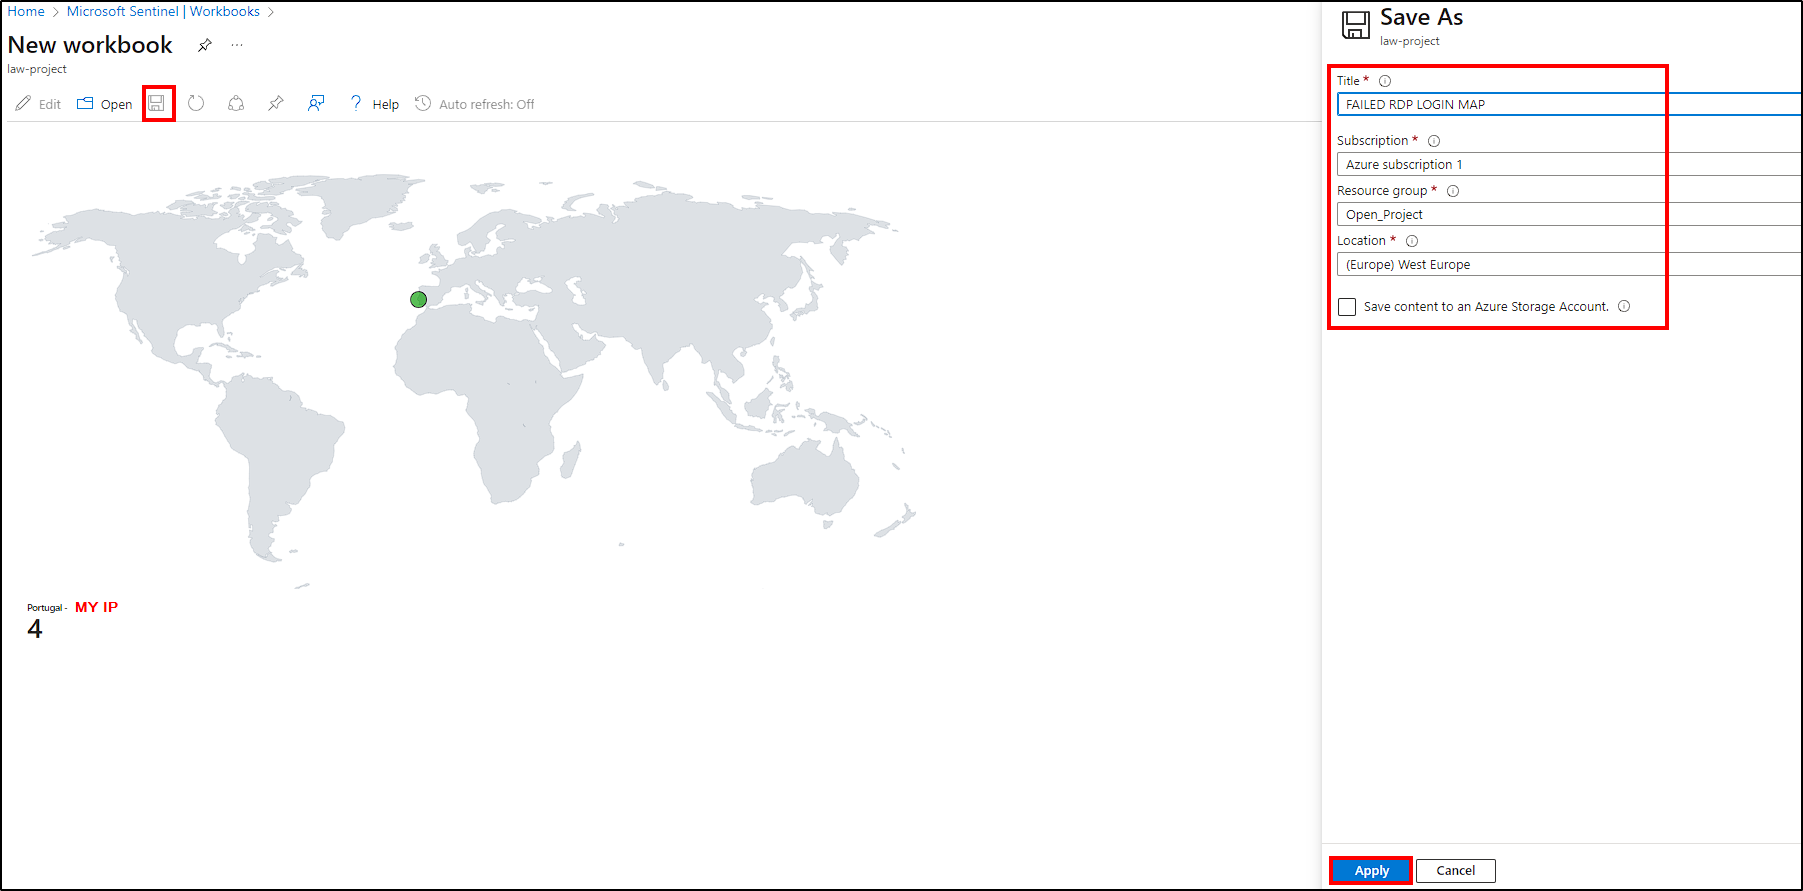
Finally, click the Visualization dropdown menu and select Map. To make some additional configurations, check Map Settings and make the following adjustments:
Layout Settings:
- Location info using - Latitude/Longitude;
- Latitude - latitude_CF;
- Longitude - longitude_CF;
- Size by - event_count.
Color Settings:
- Coloring Type - Heatmap;
- Color by - event_count;
- Aggregation for color - Sum of values;
- Color palette - Green to Red.
Metric Settings:
- Metric Label - label;
- Metric Value - event_count.
Name the workbook, assign the appropriate subscription, resource group, and region, and save it to complete its creation.
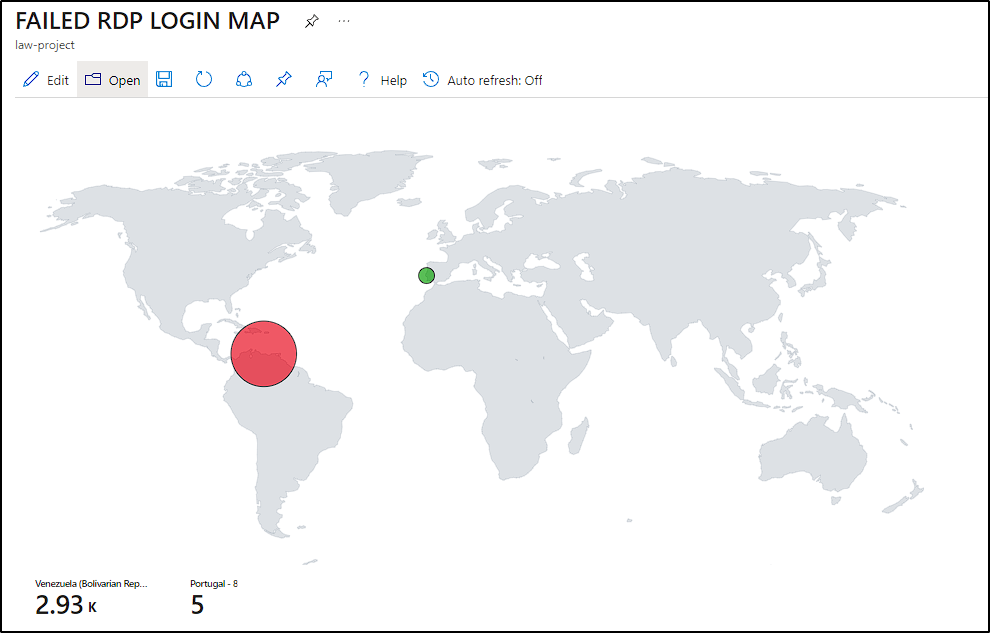
Refresh the map or set a auto-refresh timer to visualize new attempts!
Results
The map will only display Event Viewer’s failed RDP attempts and not all the other attacks the VM may be receiving!
- Day of experiment: Sunday;
- Time window: 10 hours (from 14:00 - 24:00);
- Failed RDP attempts
- Number of attempts: 2933;
- Source IP: 190.204.215.69;
- Source Location: Venezuela;
- Usernames used on BF attack: administrator;
- Duration of attack: 20:30 - 21:25.
Results Interpretation & Final Thoughts
Overall, the number of attempts was lower than expected. Maybe choosing a different location or trying on a different day would get more volume of attempts, but at least my Venezuelan brothers came to the rescue 😁. Nevertheless, this was a valuable exercise to gain hands-on experience with Azure and its capabilities.
Cleanup
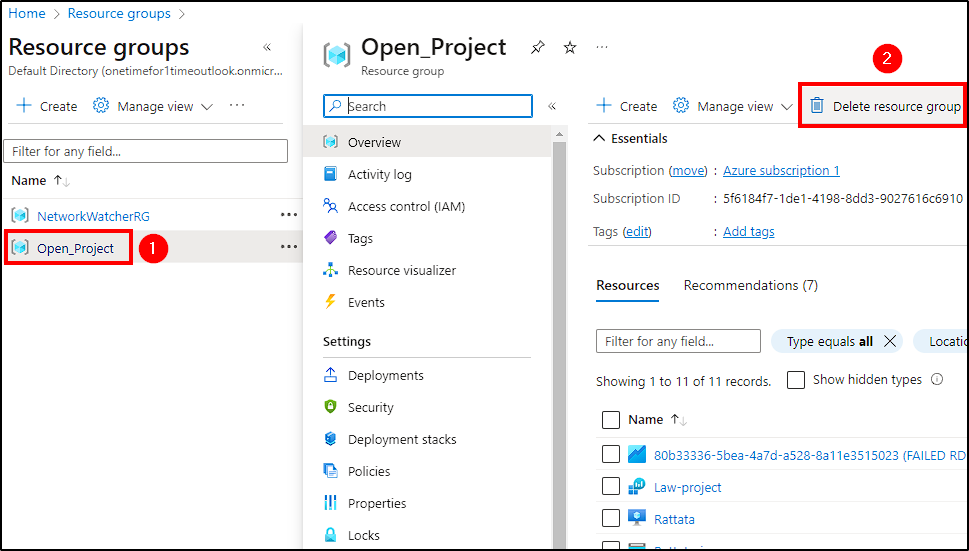
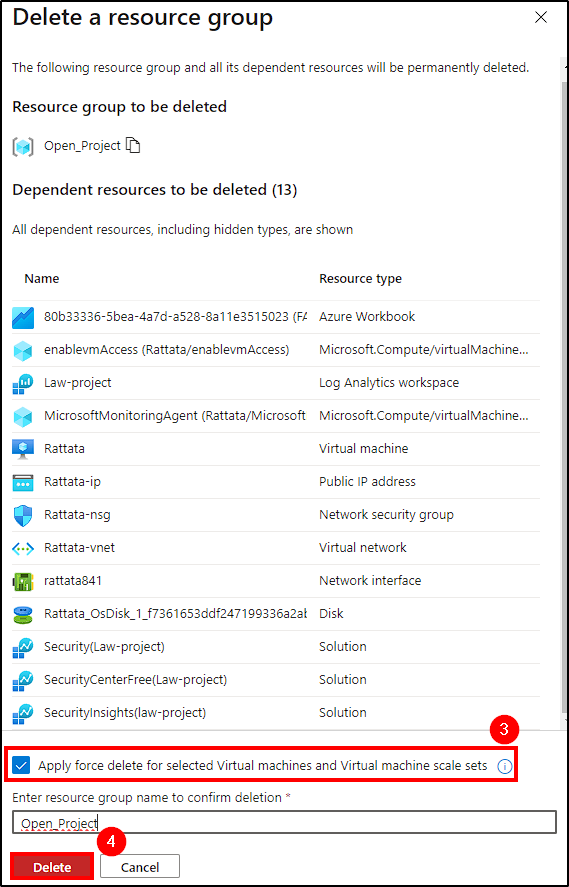
If you don’t intend to use any of the resources later, make sure you delete them or you will get charged! Simply disabling them will still incur charges because resources such as storage remain allocated.
Navigate to Resource groups, select Open_Project(name of resource group) > Delete Resource Group and delete its components.


